As the Powerball jackpot grows to over $300 million, we start to wonder if maybe buying a ticket is “worth it.” While the lottery is “worth it” in that ticket sales goes to things like state education, buying tickets is typically not worth it for yo because the projected payoff is far less than the ticket price. Continue reading “What’s the expected value of your Powerball ticket?”
Tag: statistics
Monte Carlo Simulation – Fantasy Football playoff predictor
How likely will you make the fantasy football playoffs? It’s week 11 of the Fantasy Football season, which means there’s only three more weeks until the Fantasy Football playoffs. All your hard work up to this point – drafting your team, closely following daily fantasy football podcasts and injury reports, and agonizing over who to play in your Flex spot – rests upon what happens in these next few weeks. Continue reading “Monte Carlo Simulation – Fantasy Football playoff predictor”
What are the chances a Little League baseball player gets to the Major Leagues someday?
 It’s that time of the year when Little League World Series coverage heats up on ESPN, and viewers get to see a miniaturized version of baseball played at the highest level. This year has been especially impressive with a super-team from Las Vegas that rarely makes errors, the Chicago team that beat them, and of course the sensational female pitcher Mo’ne Davis, who throws as hard as some high school pitchers. Every Little Leaguer dreams of making it to the big leagues, someday making a career of playing the game they love. But how hard is it to get there? This is a question that we will try to solve this week with the help of a spreadsheet.
Improve Agreement Accuracy with Kappa
![]() Have you heard of kappa, a measure of inter-rater agreement? In this post, we’ll delve into this statistic and see how spreadsheets can help us calculate and understand it. Continue reading “Improve Agreement Accuracy with Kappa”
Have you heard of kappa, a measure of inter-rater agreement? In this post, we’ll delve into this statistic and see how spreadsheets can help us calculate and understand it. Continue reading “Improve Agreement Accuracy with Kappa”
Averages Matter: Mean, Median, & Mode
The average value is very desirable in the world of statistics! Known as the central tendency, averages provide a way to understand the characteristics of a broad set of data. What are the different measures of central tendency? How can we calculate them? Let’s explore this below!
Hypothesis Testing with Spreadsheets – Part II
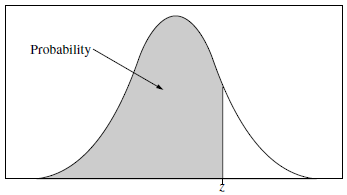
Is the “height success rate” for seeds grown in organic soil significantly higher than that for those grown in the non-organic soil? Let’s use a statistical test to find out! But before we delve in, let’s review the amazing Central Limit Theorem (CLT). Why so remarkable, you may ask? Continue reading “Hypothesis Testing with Spreadsheets – Part II”
Hypothesis Testing with Spreadsheets – Part I

What is the impact of organic soil on a seedling’s height? Will an organically-grown seedling be taller than one grown in non-organic soil? Armed with data, we’ll now tackle these questions by performing a statistical test in a spreadsheet!
To see how we our experimental design and data collection method, please see: www.spreadsheetsolving.com/posts/experiment-spreadsheet Continue reading “Hypothesis Testing with Spreadsheets – Part I”
Design & Conduct Experiments with Spreadsheets
Seeking science experiment ideas? Want to conduct an experiment? Curious about hypothesis testing? Understanding how to design and test an effective experiment is an essential skill. Let’s investigate this research question: What is the impact of organic soil on a seedling’s height?
Spreadsheets are a platform to test an experiment or conduct a research study. With spreadsheets, we can collect & organize data, compute summary statistics, and even test hypotheses!
So, let’s begin our experiment with spreadsheets, statistics, seeds, & soil! Continue reading “Design & Conduct Experiments with Spreadsheets”
Should schools adopt B.Y.O.T?
A new trend across schools has emerged: B.Y.O.T for Bring Your Own Technology. Recently, an article in the New York Times describes the debate of whether schools should adopt B.Y.O.T. Are you a fan or a critic of B.Y.O.T? Do the advantages of adopting this policy outweigh the drawbacks, or do they not? How can we think about this? Before you answer our poll, let’s first discover how we can use a spreadsheet to develop a logical framework to better inform our opinion!
[polldaddy poll=6990938]
Pythagoras and SUMSQ
Ever heard of the philosopher and mathematician, Pythagoras of the 6th century BC? Perhaps you’ve come across one his most famous theorems during your geometry class. The Pythagorean Theorem states that in a right triangle, the sum of the legs squared is equal to the hypotenuse squared.

How Analytics & Spreadsheets are changing the NBA
“‘Most teams are using spreadsheets or just using our reports,’ says Brian Kopp, executive vice-president at STATS. ‘The Raptors go a step beyond that, which only a few teams are doing, and their visualizations are the best I’ve seen.'”
This quote is taken from a piece describing how technology, statistics, and analytics are changing basketball.
Full article here.