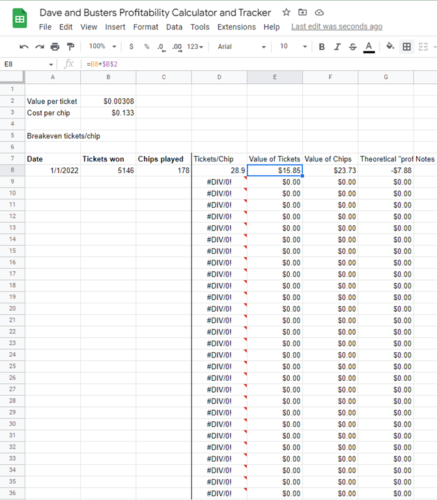
This simple Google spreadsheet will help you keep track of your Dave & Busters visits and whether they were “profitable”.
Growing up, the local Tilt arcade was one of my favorite places to spent a weekend afternoon. As an adult, I remember being intrigued by an article on advantage players at Dave and Busters – people could win enough tickets to carve out some nice side income.
How many tickets do you need to win per credit played in order to be an advantage player? Today’s spreadsheet will solve that problem!
First, calculate what tickets are worth
We can figure out what tickets are worth by taking the value of a prize and dividing by the number of tickets. A YouTube tour of the Dave and Busters Ontario location from Arcade & Travel Adventures shows the prize center, which has an Oculus Quest 2 for 130k tickets, Airpods pro for 75k tickets. Amazon has the Oculus Quest 2 for $400 and Airpods pro for $180. The Oculus implies each ticket is worth 0.308 cents and the Airpods imply each ticket is worth .024 cents.
Next, calculate the cost of chips
The best deal appears to be paying $100 to get 750 chips. This would result in a cost of about 13.3 cents per chip.
Finally, create the tracker
Our tracker will just be a simple ledger – the user will enter the date, the number of chips spent, and the number of tickets won. The spreadsheet will then calculate the value of the chips spent, the value of the tickets won, and the theoretical profit from the session. Over time by keeping track of all the sessions played, you can find out if you are profitable. Here’s how it looks, including one of my sessions at D&B where I “made” negative $7.88. Oh well, we’ll stick to the spreadsheets.
Check out the spreadsheet here: Dave and Busters Google spreadsheet tracker
Note: You can click File –> Save a Copy to save a copy for yourself to use.
Note 2: It looks like it takes about 43-44 tickets per chip in order to be “profitable” with the Value/ticket around 0.3 cents and Cost per chip around $0.13.

