Calculate a Diversity Index for NYC District 3

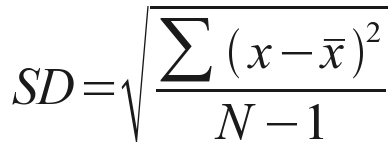
We recently posted How to Calculate a Diversity Index and suggested this could be used to look at how well mixed schools within a school district were, among other uses. Somewhat on cue, there was a major controversy in New York City’s Upper West Side, as parents debated a plan to allocate middle school seats to lower income students.  https://twitter.com/DOEChancellor/status/989728932772499457

Continue reading “Calculate a Diversity Index for NYC District 3”

How well mixed is your melting pot? Calculate a Diversity Index with a Spreadsheet

“If you can’t measure it, you can’t manage it” – supposedly Peter Drucker

A unique feature of the United States is its diverse population, tied together by shared values. Generally a commonly-embraced aspiration, diversity is promoted as a healthy feature of groups within society (usually, although the trend might appear otherwise). But can diversity be measured?

What if we could come up with an index that measures how well “mixed” a set of groups is, a so-called Diversity Score?  For instance, can we create an index such that a prison and its subset gangs falls on the less diverse/less well-mixed end and a Benetton commercial on the other? Once we have a method, we can apply it to other places like school districts, college fraternities and sororities, social groupings within a company, and many more. That’s the beauty of spreadsheets! Continue reading “How well mixed is your melting pot? Calculate a Diversity Index with a Spreadsheet”

What’s the expected value of your Powerball ticket?

As the Powerball jackpot grows to over $300 million, we start to wonder if maybe buying a ticket is “worth it.” While the lottery is “worth it” in that ticket sales goes to things like state education, buying tickets is typically not worth it for yo because the projected payoff is far less than the ticket price. Continue reading “What’s the expected value of your Powerball ticket?”

Use a spreadsheet to check Matthew Berry’s Top 200 Fantasy Football Rankings results from Week 1

“It’s hard to make predictions, especially about the future”  Various

Usually, improvement in prediction-making comes in two steps.  Step 1: Make a Prediction.  Step 2: Evaluate how accurate the prediction was, and learn from it.  Often times, Step 2 can get overlooked as we move on to future predictions and future weeks of fantasy football.  Spreadsheets can help us quickly evaluate how our predictions were, and quickly point out where we might have erred.

Continue reading “Use a spreadsheet to check Matthew Berry’s Top 200 Fantasy Football Rankings results from Week 1”

What are the chances a Little League baseball player gets to the Major Leagues someday?

baseballIt’s that time of the year when Little League World Series coverage heats up on ESPN, and viewers get to see a miniaturized version of baseball played at the highest level. This year has been especially impressive with a super-team from Las Vegas that rarely makes errors, the Chicago team that beat them, and of course the sensational female pitcher Mo’ne Davis, who throws as hard as some high school pitchers. Every Little Leaguer dreams of making it to the big leagues, someday making a career of playing the game they love.  But how hard is it to get there? This is a question that we will try to solve this week with the help of a spreadsheet.

Continue reading “What are the chances a Little League baseball player gets to the Major Leagues someday?”

Bayes’ Rule, Oscars, & Golden Globes

TechsmithWor50C6.pngHave you heard of Bayes’ Rule? Let’s use an intuitive example to understand an application of this rule. What’s the probability American Hustle wins the Golden Globes given it wins the Oscars? Continue reading “Bayes’ Rule, Oscars, & Golden Globes”

Improve Agreement Accuracy with Kappa

TechsmithWor2DE0.pngHave you heard of kappa, a measure of inter-rater agreement? In this post, we’ll delve into this statistic and see how spreadsheets can help us calculate and understand it.  Continue reading “Improve Agreement Accuracy with Kappa”

Predicting a Tennis Pro’s Weight based on Height

TechsmithWorEE2E.pngWith a Grand Slam approaching, let’s talk tennis! If we were to predict a tennis pro’s weight based on his height, where would we begin? How will our understanding of the best-fit line and spreadsheets help us make this prediction?

We’ve collected the heights and weights of tennis pros including Federer, Djokovic, Nadal, Murray, Azarenka, Sharapova, and Williams, along with another 192 top players. Let’s investigate how to 1) calculate the correlation of weights and heights, and 2) draw a best fit-line and scatter plot in Google spreadsheets to extrapolate or make predictions!

Continue reading “Predicting a Tennis Pro’s Weight based on Height”

Probabilities & Dice Roll Simulations in Spreadsheets

Dice
Photo: Amie Chuang

What is the probability of rolling any pair of numbers with two dice? Let’s first solve this and then confirm our calculated probability by simulating 500 dice rolls with a spreadsheet! In this post, we will focus on understanding basic probability concepts and then discover how with spreadsheets, we can actually see whether our calculated probability holds true!

Continue reading “Probabilities & Dice Roll Simulations in Spreadsheets”

Breaking it down: Sample Standard Deviation

We have a set of data and want to understand its characteristics. A great starting point is to measure the central or typical value and the dispersion around that value. In this post, we will focus on the latter – specifically a standard measure of spread known as the sample standard deviation!

Continue reading “Breaking it down: Sample Standard Deviation”

Averages Matter: Mean, Median, & Mode

Illustration by Amie

The average value is very desirable in the world of statistics! Known as the central tendency, averages provide a way to understand the characteristics of a broad set of data. What are the different measures of central tendency? How can we calculate them? Let’s explore this below!

Continue reading “Averages Matter: Mean, Median, & Mode”