How much is your low interest rate mortgage worth?

One of the ideas floating around lately is that if you were lucky enough to secure a low interest rate, it is actually a hidden asset in your net worth.

Of course, it’s a little more complicated than that, for example if you move/sell you have to repay your mortgage and that asset would disappear, which is not what typical assets actually do.

But let’s have some fun for a moment and pretend that by borrowing at a low rate we have effectively shorted a 30 year bond, and see how much value we have generated by this trade.

We’ll repurpose our debt amortization spreadsheet from an earlier post.

All we need to do now is to to add a few additional inputs – how many years are left on the mortgage, and what the current mortgage rate is. We’ll then calculate the net present value of the remaining mortgage payments for each year using the current mortgage rate as the discount rate. The difference between that NPV and your mortgage principal is the “asset value”. 

In this example, in year 5 on an original $500k mortgage at 3.25%, the “asset value” of keeping this mortgage when the current market mortgage rate is 7.9% is $170k!
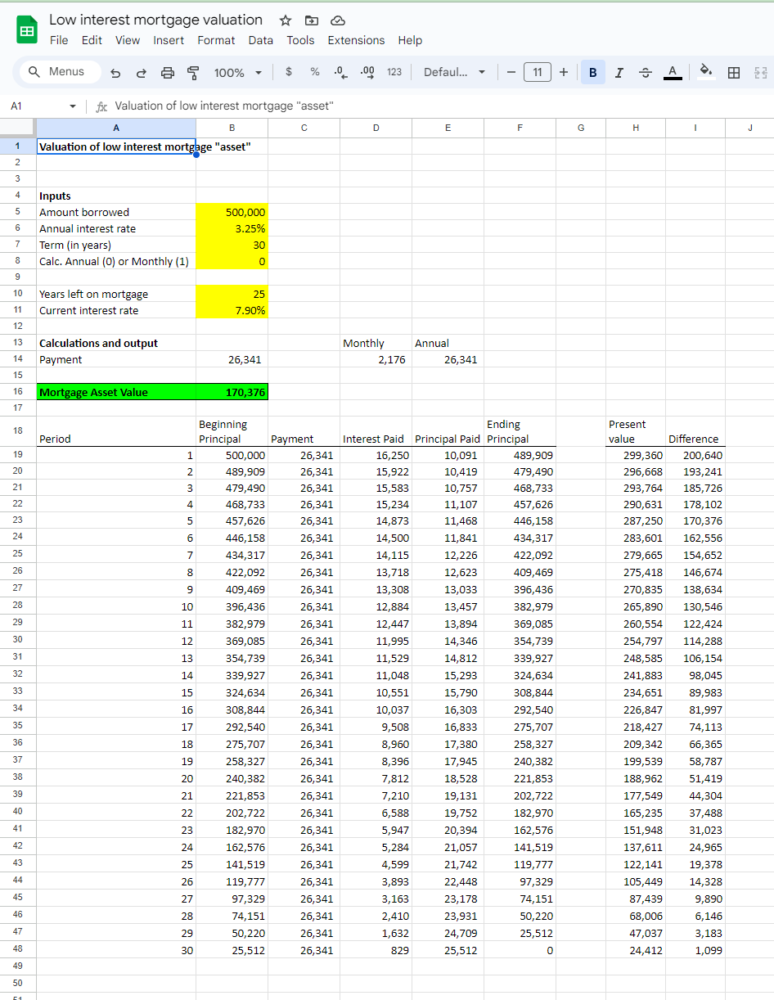
You can play with the Google Spreadsheet here

Spreadsheetsolving.com’s compilation of free, customizable, printable math worksheet generator spreadsheets

With summer starting, we thought it would be helpful to put all of our math worksheet generator spreadsheet posts into one (somewhat) organized list. We’ve been creating these spreadsheets over the past three years to help supplement math learning for our own kids.

Note that all of these spreadsheet generators are done in Microsoft Excel. In order to use the free Google Sheets software, you can download and save the .xlsx file onto your computer, go to Google Sheets, and then hit File->Import-> Upload, and select the file. It might need some minor formatting/fitting to print.

Math Worksheets

General Math Worksheet generator – allows parent to set the maximum number size, and what operation, generates a random math worksheet: random math worksheet

Fill in the blank Math Worksheet generator – similar to the prior math worksheet, but instead of figuring out the sum in a standard (addend + addend = sum) problem, one of the three is randomly blank and the student fills in the blank: Math Worksheet generator

Division Math Worksheet generator – the logic and format for a division math worksheet generator was slightly different from the previous: Division Math Worksheet

Addition and Subtraction Math Facts speed spreadsheet – similar to the general purpose spreadsheet but designed to be a speed test of addition and subtraction math facts: Addition and Subtraction Math Facts Speed Worksheet

Number sequence pattern math worksheet generator – here you have a sequence of numbers and can choose spacing, number size, number of blanks for the student to fill out: Number Sequence Pattern Math Worksheet

Math Dice style worksheet – students try use math functions on the randomly generated input numbers to get to the answer number: Math Dice Worksheet

Practice with time math worksheet generator: Time Math Worksheet

Math word problem worksheet generator – this one is a bit crude, but perhaps someone could expand upon it: Math Word Problem Worksheet

Printable Flash Cards

General Purpose Flash Cards with user input and double sided printing: https://spreadsheetsolving.com/create-and-print-physical-flash-cards-with-this-microsoft-excel-template/

Addition and subtraction with math facts under 20 – Here we use our general purpose flash cards spreadsheet and enter in some math facts that students should have memorized: https://spreadsheetsolving.com/printable-math-facts-flash-cards-for-single-digit-addition-and-subtraction-with-carrying/

Multiplication Flash Cards: https://spreadsheetsolving.com/printable-multiplication-flash-cards-spreadsheet/

Division Flash Cards: https://spreadsheetsolving.com/printable-division-facts-flash-cards-spreadsheet/

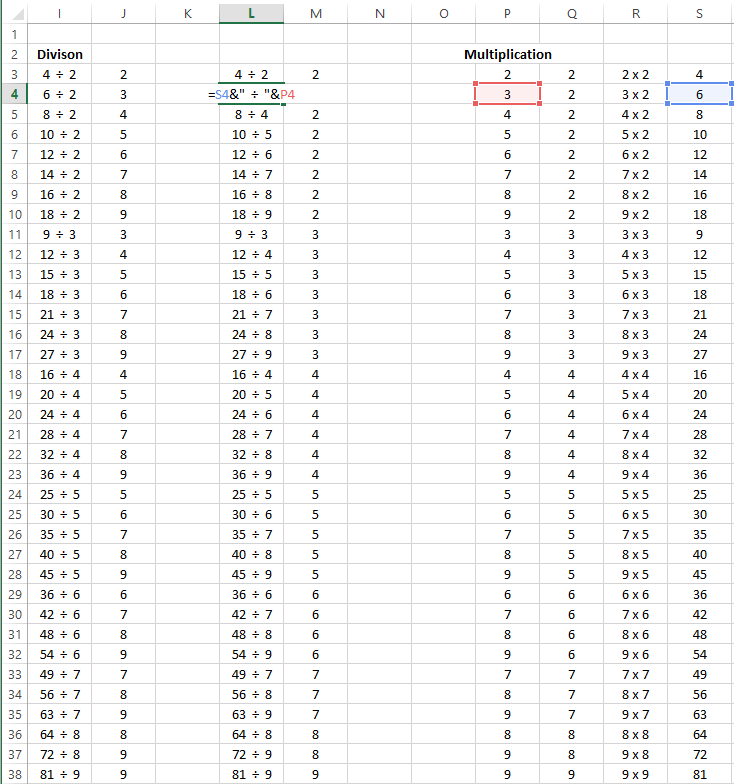
Printable division facts flash cards spreadsheet

Today’s post is another extension of our series on flash cards. Since we made our multiplication flash cards last, the division flash cards were easy to make by reversing the multiplication answers:

We basically need double the flash cards since 20 divided by 5 and 20 divided by 4 are two different problems, whereas 4×5 and 5×4 are effectively the same.

Download the printable division flash cards spreadsheet here:

Printable Division Math Worksheet Generator Spreadsheet

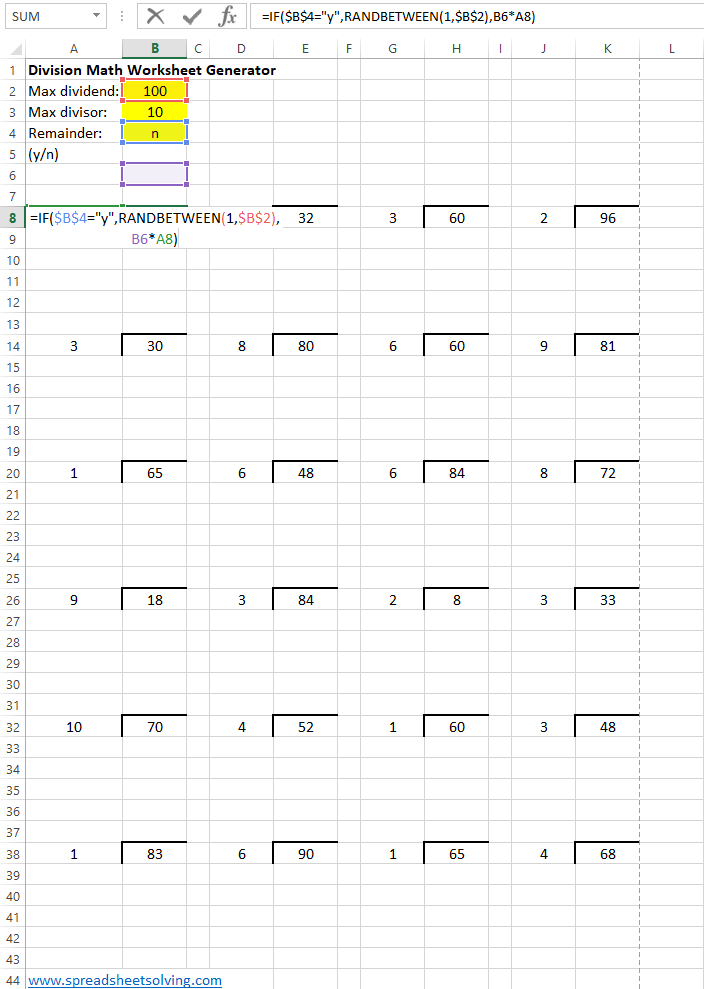
Today we’ll build a dedicated division spreadsheet, where we set parameters for the problems and print an unlimited number of different division worksheets.

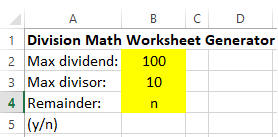
The inputs we’ll allow the user to enter are the maximum dividend (number to be divided) size, the maximum divisor, and whether or not we want to have the answers be able to have remainders.

So if the user selects yes or “y” for the remainder, the problem is relatively simple – we’ll have a random number for the answer between (1,100) for the dividend, and then a random number between (1,10) for the divisor.

If the user selects “n”, we’ll have a random number between (1,10) for the divisor, and then a random number between 1 and the max dividend/current divisor for the answer, then we’ll multiply the answer by the divisor to get the dividend.

Here’s how it looks like in full:

You can download the printable Microsoft Excel file here:

Printable time and clock math worksheet generator

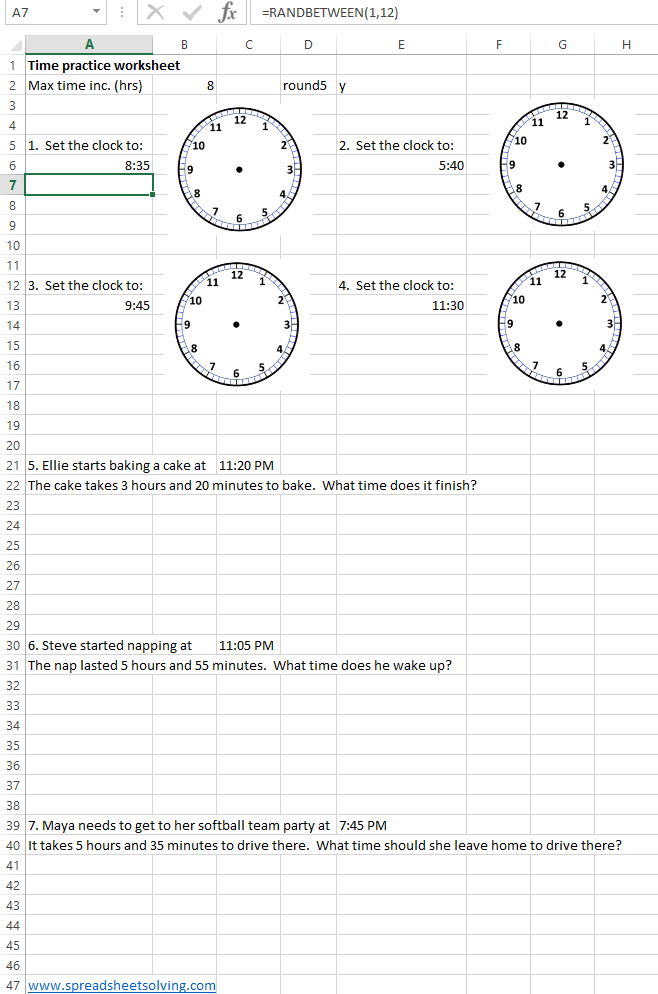
Today’s printable math work sheet generator will center around the concept of time.

We’ll have two types of questions – one will ask the student to draw in the hands on a blank clock face for a random time. The other type of question will be a word problem that provides a start time and a time increment and asks the student to calculate the finish time. We would have loved to generate a random clock face time and ask what time it is but that turns out to be incredibly difficult in a spreadsheet.

To create the random times, we use the formula =RANDBETWEEN(1,12) for the hours, and then =RANDBETWEEN(0,59) for the minutes, then use the formula =TIME(hours, minutes, 0 seconds) for the time to display. We also added in some logic to allow for the times to round to 5’s if the user puts in a “y” in cell E2.

Check out the spreadsheet here:

Here’s how the final product looks:

Printable Multiplication Flash Cards spreadsheet

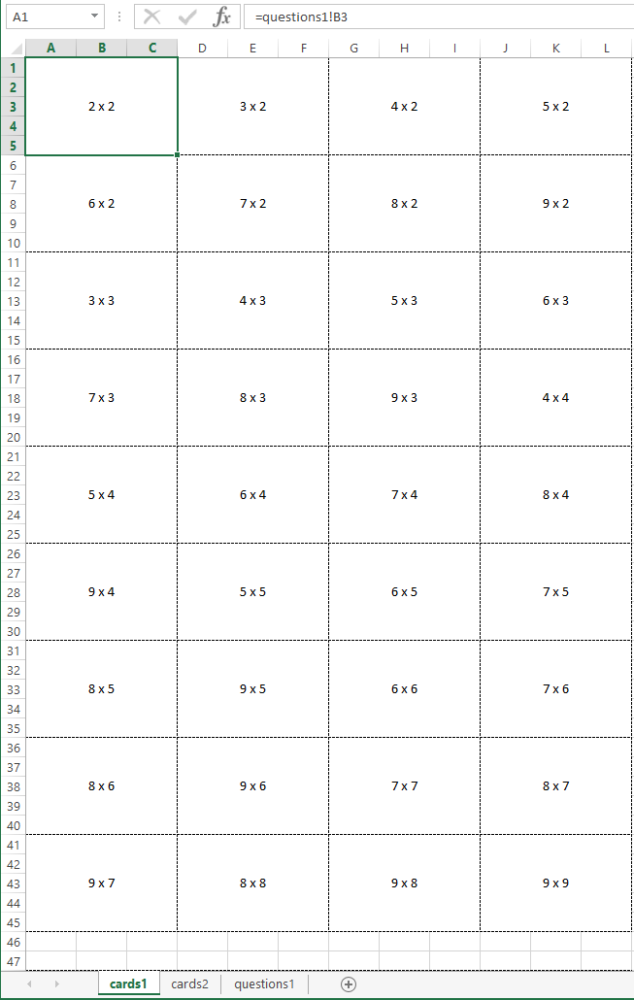
Today’s post is another extension of our very flexible Printable Flash Card Generator Spreadsheet. We plugged in the single digit multiplication combinations from 2-9 into the second sheet. To print the cards, print the first sheet two-sided, flip on the long edge, then cut the cards out.

Download the printable multiplication flashcard spreadsheet here:

Build a T-Ball or Softball lineup and positions generator

This season marks my youth softball coaching debut, an opportunity to impart my likely outdated baseball knowledge on a group of 5 and 6 year old girls. Beyond trying to stay positive and excited for an hour plus, the main challenge of coaching is organizing all the various tasks that come up.

One such task is setting a weekly lineup, which requires setting a batter order and assigning fielding positions by inning.

Some of the key rules that we’ll want to implement in the lineup:

  1. Randomize the batting order each week.
  2. Rotate the players on defense so that players don’t spend two innings in a row in the outfield, and the choice spots (pitcher, 1B) get fairly distributed.

Spreadsheet Logic

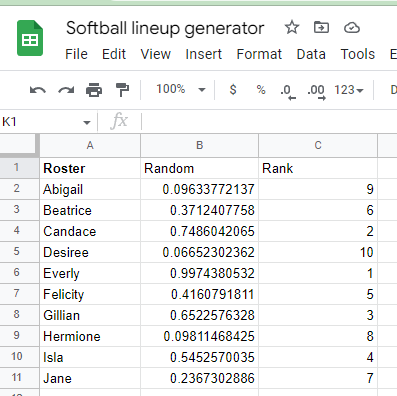
First we enter in all the names of the girls on the team, and for each week, we’ll assign a random number 1-10 which will be their spot in the order:

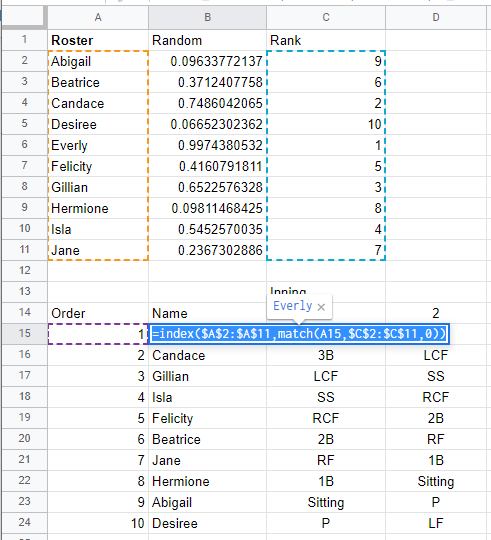
Then we can put them in order using Index(match):

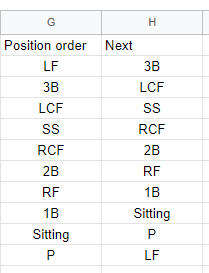
Then we want to set up a rotation for the field – we use two columns, with the right column showing what position they will play after playing the left column. Players will rotate from LF to 3B to LCF to SS to RCF to 2B and so on:

We’ll then set the positions for the first inning, then for each subsequent inning, we’ll lookup the next position from the table above with vlookup:

And that’s the spreadsheet, you can check it out here: Softball Lineup Generator

To save a copy, go to File –> Make a copy

Addition and Subtraction Math Facts Speed Worksheet

Today’s post will be another variation of our generic Math Worksheet Generator that we’ve posted before. This worksheet will give students the opportunity to practice their addition and subtraction math facts, so that eventually  things like 9+7 = 16 and 17-9 = 8 will come more quickly.

For the subtraction facts spreadsheet, we made the first number a random number between 11 and 18, and the second number a random number between the first number minus 9 and 9, in order to make the answer a single digit math fact.

For the addition spreadsheet, we made the answer a random number between 11 and 18, and then hid it, then filled in the two addends with one random number and then the answer minus the random number.

Check out the spreadsheet here. We’d also recommend using a stopwatch to help students try to increase speed: Addition and Subtraction Speed Worksheet

Dave and Busters breakeven tickets per chip under different chip cost and ticket value scenarios

Today we’ll continue with the theme from our last post on a Google Sheet Dave and Busters profitability tracker. One frequent question that arises in the Dave and Busters Reddit forum is: How many tickets does one need to be winning to be “profitable”?

The answer is usually some combination of “it depends”; it is based on chip cost and ticket value (and perhaps some mentions of finger traps, etc.).

To solve this problem, first we enter a formula for the breakeven tickets given a value/ticket and cost/chip. With some simple algebra, we find that:

breakeven ticket/chip = (cost per chip) / (value per ticket)

Here’s that depicted in spreadsheet form:

Next, we’ll make a data table which inputs various different costs per chip (based on the different price points of the tickets that are offered), and various different values per ticket. The output is this nice table below:

We can confirm we’re only an “advantage player” when it comes to redeeming for burgers and churros for ourselves at 10 tickets per chip breakeven.

Download the Excel spreadsheet here: Dave and Busters ticket breakeven calculator

You can also enter your own values in the Cost per chip (cells B26: B35) and Value per ticket (cells C25: J25).

Build a Dave and Busters tracker for chips spent, tickets earned and “profit”

This simple Google spreadsheet will help you keep track of your Dave & Busters visits and whether they were “profitable”.

Growing up, the local Tilt arcade was one of my favorite places to spent a weekend afternoon. As an adult, I remember being intrigued by an article on advantage players at Dave and Busters – people could win enough tickets to carve out some nice side income.

How many tickets do you need to win per credit played in order to be an advantage player? Today’s spreadsheet will solve that problem!

First, calculate what tickets are worth

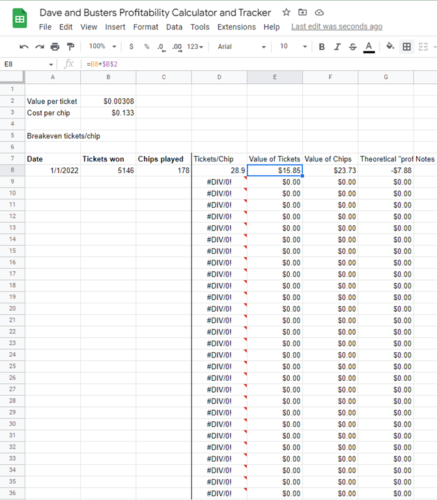
We can figure out what tickets are worth by taking the value of a prize and dividing by the number of tickets. A YouTube tour of the Dave and Busters Ontario location from Arcade & Travel Adventures shows the prize center, which has an Oculus Quest 2 for 130k tickets, Airpods pro for 75k tickets.  Amazon has the Oculus Quest 2 for $400 and Airpods pro for $180.  The Oculus implies each ticket is worth 0.308 cents and the Airpods imply each ticket is worth .024 cents.

Next, calculate the cost of chips

The best deal appears to be paying $100 to get 750 chips.  This would result in a cost of about 13.3 cents per chip.

Finally, create the tracker

Our tracker will just be a simple ledger – the user will enter the date, the number of chips spent, and the number of tickets won. The spreadsheet will then calculate the value of the chips spent, the value of the tickets won, and the theoretical profit from the session. Over time by keeping track of all the sessions played, you can find out if you are profitable. Here’s how it looks, including one of my sessions at D&B where I “made” negative $7.88. Oh well, we’ll stick to the spreadsheets.

Check out the spreadsheet here: Dave and Busters Google spreadsheet tracker

Note: You can click File –> Save a Copy to save a copy for yourself to use.

Note 2: It looks like it takes about 43-44 tickets per chip in order to be “profitable” with the Value/ticket around 0.3 cents and Cost per chip around $0.13.

Create a customizable and printable check-off calendar spreadsheet

Now that are kids are getting older, we want to start getting them into good daily habits. This usually requires quite a bit of encouragement / threatening, but what might work best at the end of the day is bribery.

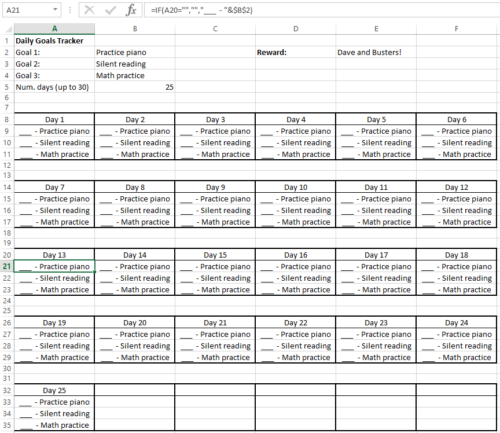
We created this customizable check off calendar that allows the user to pick their “tasks”, the number of days (up to 30), and the prize (we recently introduced our kids to Dave & Busters and they love it). The spreadsheet then lists the tasks with a check box for the number of days selected. The key logic here was the IF() Function.

The spreadsheet can be downloaded here. Enjoy! Habits Calendar Spreadsheet

How a 6% mortgage rate should affect home prices

Today’s post will be an application of our 2019 house rent vs. buy spreadsheet. With the recent jump in mortgage rates to near 6%, we wonder how much house prices are supposed to be down (in theory) if a buyer were perfectly rational and would demand the same internal rate of return from their housing purchase decision.

We’ll pull up our mortgage spreadsheet and enter in some very average metrics for the US:

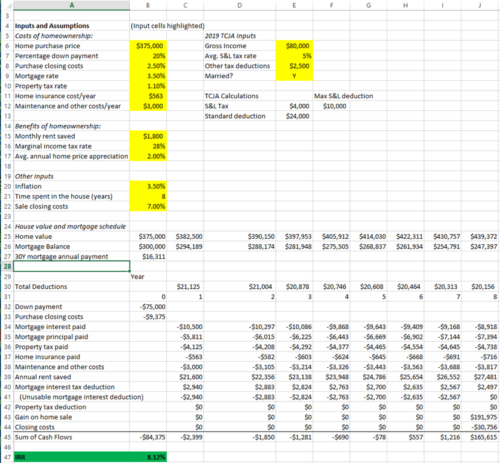
Home price: $375k, Median rent: $1,800/month, time spent in house before selling: 8 years, rent and other cost inflation: 3.5%, down payment: 20%

We’ll start our mortgage rate at 3.5%, and found the IRR to be 8.12%.

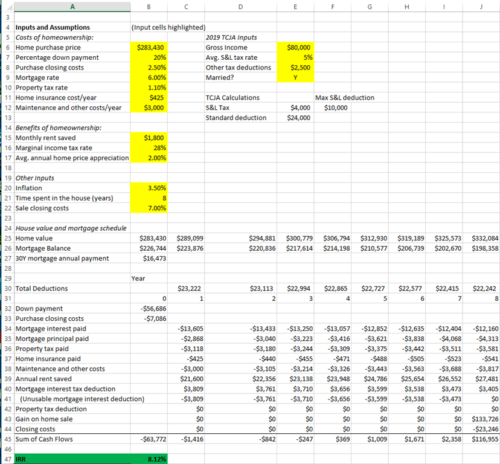
With a mortgage rate of 6%, in order to keep the IRR of buying the house at 8.12%, the house price would have to be $283,430, which is 24% less than the original house price!