Printable division facts flash cards spreadsheet

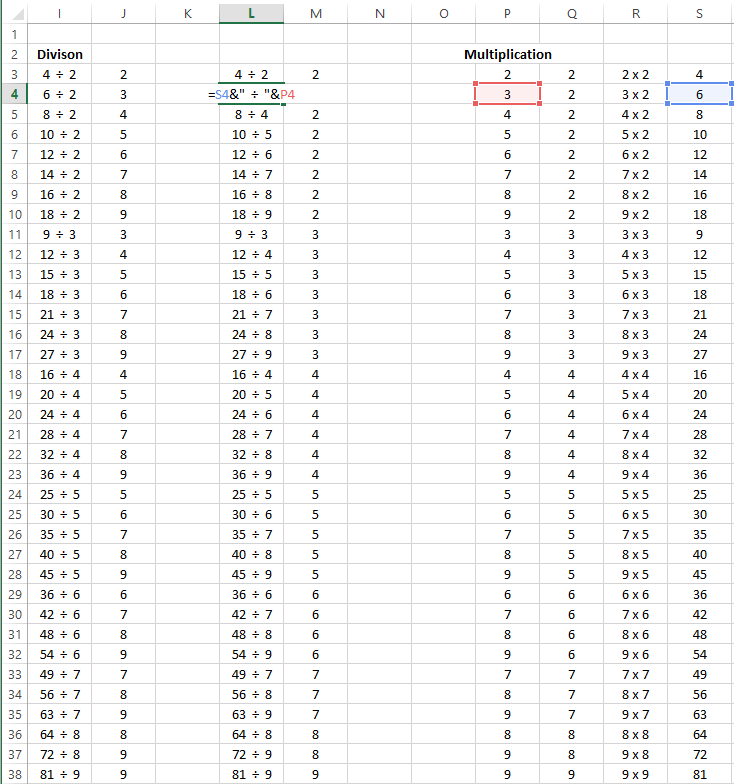
Today’s post is another extension of our series on flash cards. Since we made our multiplication flash cards last, the division flash cards were easy to make by reversing the multiplication answers:

We basically need double the flash cards since 20 divided by 5 and 20 divided by 4 are two different problems, whereas 4×5 and 5×4 are effectively the same.

Download the printable division flash cards spreadsheet here:

Printable time and clock math worksheet generator

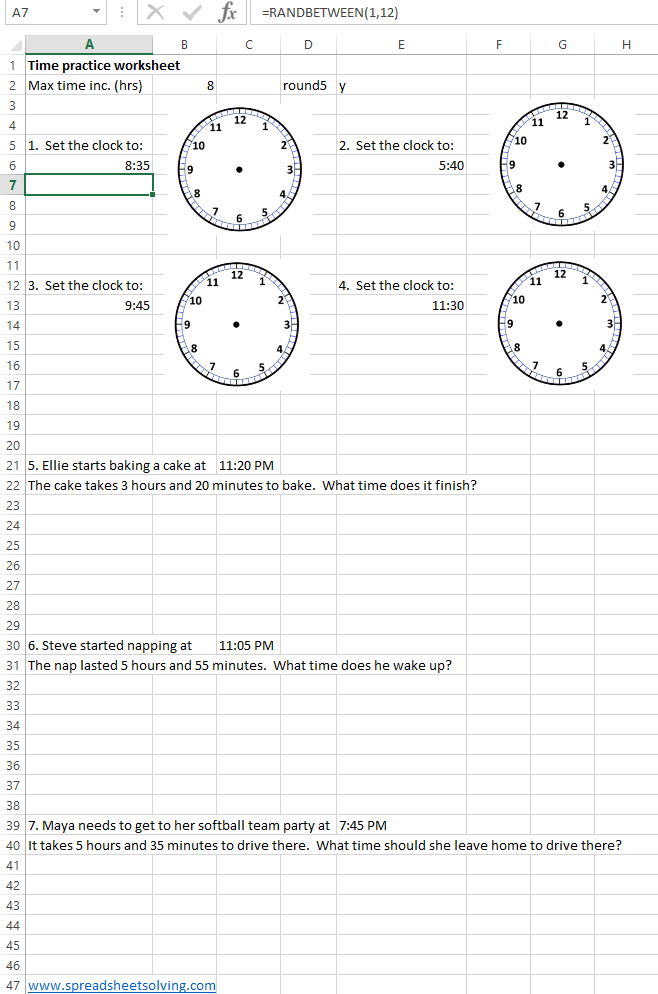
Today’s printable math work sheet generator will center around the concept of time.

We’ll have two types of questions – one will ask the student to draw in the hands on a blank clock face for a random time. The other type of question will be a word problem that provides a start time and a time increment and asks the student to calculate the finish time. We would have loved to generate a random clock face time and ask what time it is but that turns out to be incredibly difficult in a spreadsheet.

To create the random times, we use the formula =RANDBETWEEN(1,12) for the hours, and then =RANDBETWEEN(0,59) for the minutes, then use the formula =TIME(hours, minutes, 0 seconds) for the time to display. We also added in some logic to allow for the times to round to 5’s if the user puts in a “y” in cell E2.

Check out the spreadsheet here:

Here’s how the final product looks:

Build a Math Pattern Recognition Worksheet

Well, we’ve officially lost count of how many weeks of quarantine have passed. For us, quarantine started with a nice streak of weeks posting educational kids activities spreadsheets. Now our time is mostly filled with work, kids, trying to stay sane, and streaming video services.

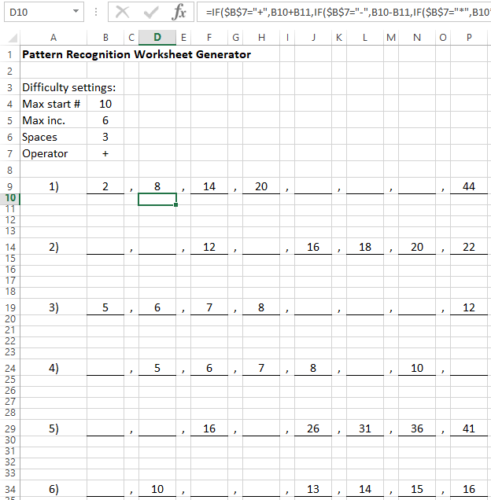
Today’s spreadsheet generates a unique math pattern recognition spreadsheet for kids. It refreshes each time the key F9 is pressed. You can adjust the difficulty level of this sheet by setting inputs, such as the size of the numbers and increments, the number of blank spaces to fill in with more blanks adding more challenge, and whether to use addition, subtraction or multiplication.

Feeling way too lazy to walk step by step through how this was built, we include the link of the spreadsheet below. Feel free to download and click through the formulas yourself! (Hint – the formulas are hidden in the four rows after each question, change the cell formatting back to “General” to see it)

Download the spreadsheet: Math Pattern Recognition Worksheet

Teach kids to multiply with this spreadsheet

Today’s spreadsheet may help you introduce the concept of multiplication to your kids. Rather than walk through how to build the sheet step-by-step, we’ll include the download link and focus on how it works and how we tried (only semi-successfully with the bribe of TV) to use it.

Download the spreadsheet here: Multiplication Spreadsheet

How it Works

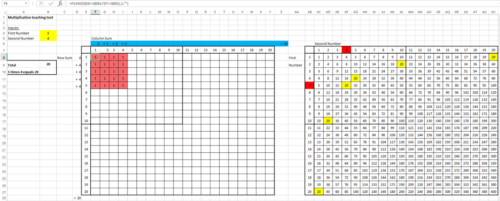
The spreadsheet includes 2 tables – a visualization grid and a traditional times-table.

First, input any two numbers (from 1 to 20) you wish to multiply. In our example, we entered 5 x 5 by putting 5 in the input cells B4 and B5 (highlighted in yellow). You can go as low as 1 x 1 and up to 20 x 20.

Now let’s explore the visualization grid (on the left) and the traditional times-table.

How to Use it
  • Visualization Grid: This grid is designed to help kids visualize the multiplication concept, by tapping into their understanding of counting and addition.

For our example, you will see a a 5 x 5 block of 25 pink cells. As a start, the kids can count the cells. Next, you can direct them to the blue row on top across the top of the grid. Here you can see that 5 x 5 is broken out into a more familiar addition problem of 5 + 5 + 5 + 5 +5 = 25.

  • Times-Table: On the right is a standard times table, where we tried to highlight the relevant square. So, in our example, you’ll see that the inputs 5 and 5 are highlighted in red and the answer, 25 is highlighted in yellow.

You’ll notice that if you try different combinations, you may see more than one cell in yellow. For instance, if we used 4 x 5, then every cell with 20 will be in yellow (this is a conditional formatting nightmare).

Let us know if you tried this sheet out with your kids or if have some elegant solution for formatting the right table!
Build a Printable Math Worksheet Generator Spreadsheet

Now two months into lockdown, we’re already scraping the bottom of the barrel when it comes to kids’ activities. No one wants to play our Math Dice Spreadsheet anymore. Why not torture educate them with a potentially never-ending stream of repetitive math reinforcement? Kidding aside, a mastery of arithmetic is a prerequisite for the (only slightly) more advanced problem solving examples that we provide here at spreadsheetsolving.com…

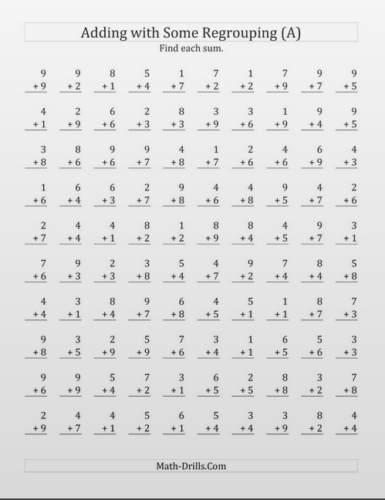
We basically want to create a spreadsheet that creates a bunch of random arithmetic problems that looks like this and can be printed:

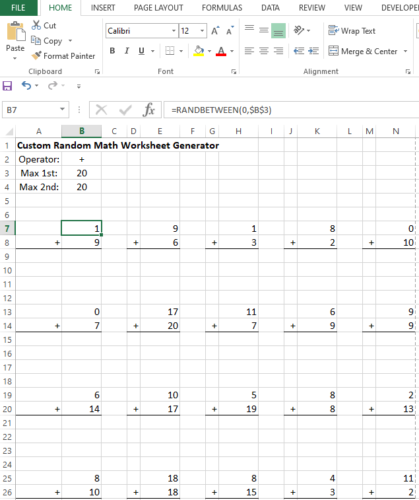
Spreadsheet Inputs

  • What arithmetic operator we are practicing (+,-,x,/)
  • The largest possible value of the first number (one can adjust the difficulty by allowing more digits for each number you are working with.
  • The largest possible value of the second number.

Spreadsheet Outputs

This is another relatively simple spreadsheet – we’ll again use the randbetween() function to generate random numbers between 0 and the maximum values. The challenge with this spreadsheet is the formatting and making things look presentable. I’ll save you the gory details and just post the file here:

Download the Excel .xls file by clicking here: Custom Math Worksheet Generator

For another spreadsheet that combines both addition and subtraction on the same sheet, click here: Custom Math Worksheet Generator 2

What makes a good business? Part 3 of the IRR trilogy

This post was inspired by reading a Quora response where the child of a top 1% family says that one of the advantages of his upbringing is that his parents taught him about how business works. “Business” is a somewhat broad term that some schools say takes two years and $120k in tuition to “master”. However, as we typically do in this blog, we can educate ourselves on some of the central concepts of business on our own through spreadsheets!

image

Our hope is that anyone with internet access can find this page and play around with spreadsheets to begin to think about what makes a good business. Now if only this site could also provide the exotic travel experiences, connections, and the ability to take risks with a safety net that growing up in the 1% also provides… Continue reading “What makes a good business? Part 3 of the IRR trilogy”

Is medical school “worth it”? An introduction to Internal Rate of Return (“IRR”)

Finance hiring is down, law school grads are having a tough time finding real law jobs, so what is an ambitious but risk averse college student to do with his or her life these days? Okay, right now the answer is computer science. Yes seriously, do computer science. But let’s pretend it is the year 2001 and the only other option respectable option is medical school. But doesn’t med school take a lot of time (4 years school plus 3-7 years residency/fellowship) and cost a lot of money? How can we figure out if going to med school and not earning doctor money until 7 years from now is worth it financially relative to just entering the workforce and working for those 7 years? Continue reading “Is medical school “worth it”? An introduction to Internal Rate of Return (“IRR”)”

Build a Spreadsheet to help you choose a healthcare plan

Will you save more with standard PPO or a high-deductible PPO Saver plan with a Health Savings Account?

It is currently Open Enrollment season at many workplaces, which is when employees choose their medical insurance and other benefits plans for the upcoming year. It’s also the time of year when people grumble “why is the US healthcare system so complicated” and just elect whatever plan they had in the prior year. Building a spreadsheet can help someone compare the costs and benefits of each of the plans under a variety of different assumptions about tax rate and healthcare expenditure. Continue reading “Build a Spreadsheet to help you choose a healthcare plan”

Do you want the stock market to go up or down?

At first glance, it sounds like an obvious question – surely it is better when stocks go up, right? From watching the ads on CNBC, it would seem that higher stock prices directly translate into more steak dinners and golf vacations while lower stock prices mean bringing your own peanut butter sandwiches to work (jelly is for bull markets). Continue reading “Do you want the stock market to go up or down?”

Bayes’ Rule, Oscars, & Golden Globes

TechsmithWor50C6.pngHave you heard of Bayes’ Rule? Let’s use an intuitive example to understand an application of this rule. What’s the probability American Hustle wins the Golden Globes given it wins the Oscars? Continue reading “Bayes’ Rule, Oscars, & Golden Globes”

Improve Agreement Accuracy with Kappa

TechsmithWor2DE0.pngHave you heard of kappa, a measure of inter-rater agreement? In this post, we’ll delve into this statistic and see how spreadsheets can help us calculate and understand it.  Continue reading “Improve Agreement Accuracy with Kappa”

What’s the Volume of a Pyramid?

TechsmithWor7C5E.pngHow many cubic feet of sand can a pyramid hold? Did you know that it is exactly 1/3 of the volume of a rectangular prism with the same height, base, and width as the pyramid? Let’s use spreadsheets to confirm this and calculate the volume of other geometric solids.

Continue reading “What’s the Volume of a Pyramid?”