The COVID-19 outbreak has caused many families (including us) to be stuck at home with their kids. While not having to commute has been great, we’re two days in and quickly running out of interesting activities. Perhaps now is the perfect time to learn how to build spreadsheets to analyze data?
If you’re interested, we’ve organized certain spreadsheet skills into a curriculum of sorts, located here. However, the best way to learn spreadsheets (and the motto of our website) is to use them to solve real world problems and figure out how to get through roadblocks on the way.
So today’s spreadsheet is a simple one. We’ll build a sheet that can track coronavirus cases in the US by following the CDC data. First, we navigate to the CDC website tracking COVID-19 cases and then copy in the data near the bottom of cases reported in the US by onset date:
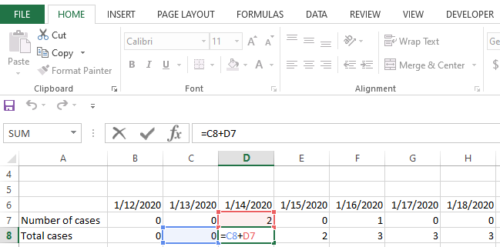
We paste this into our spreadsheet and add a formula in the row below to keep a running tally of cases:

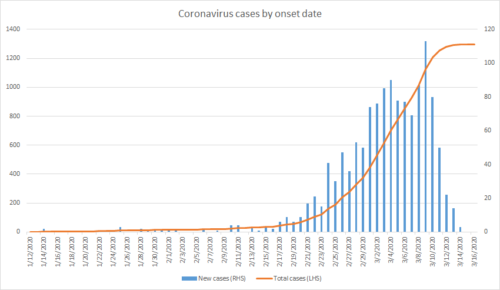
A few clicks later, and we produce this spiffy graph:
The total numbers looked low, so I should probably paste in the data asterisks:
To access this spreadsheet on Google Docs, you can find it here: COVID-19 Case Tracker


