In this post, we’ll show you how to compare different credit cards that have different sign-up bonuses, annual fees, rewards, etc. We’ll use the NPV function, which allows us to compare different streams of cash flows that come at different times.
A word of caution: Our post assumes that you’ll pay off your credit card in full each month. As we mentioned in our personal finance modeling post, the rate of return earned on investments is one of the key factors in achieving long term financial independence. We assumed getting a 4% return on our investments…the average interest rate you’d have to pay on a credit card balance is 15%! That’s like having a huge negative investment, which could keep you in the poor house.
Spreadsheet inputs
We’ll take a sampling of three of the most popular rewards cards out there today, which we found at this Nerdwallet page using a Google search.
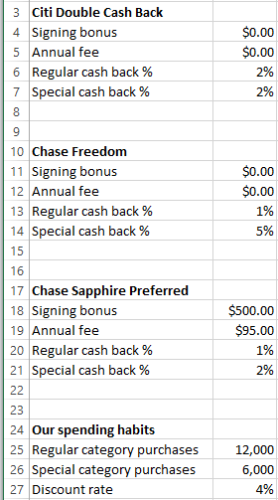
1. Citi Double Cash Back – This card is remarkably simple: 2% cash back on all purchases, no sign up bonus, no annual fee.
2. Chase Freedom – This card offers 1% back on all purchases, and 5% back on a rotating category with a limit of $1500 in rotating category purchases (for example, this quarter it is on restaurants). There is also no sign up bonus and no annual fee.
3. Chase Sapphire Preferred – This card is a little more complex: you get 2 points (about 2%) for travel and dining purchases, and 1 point for other purchases. There is a $95 annual fee that is waived the first year, and there is a $500 sign up bonus.
Here’s how it looks in our spreadsheet so far:
Next, we’ll input our own personal spending habits, which will be variables that can be changed:
1. Total credit card purchases per year.
2. Total credit card purchases in special categories per year.
3. Our internal discount rate for money received in the future. We’ve touched on this concept in the past, but a dollar tomorrow is worth less than a dollar today. If we assume a 4% rate, than we’d be indifferent about receiving $1.04 in one year or $1 today.
Spreadsheet Logic & Output
We’ll simplify things a bit and assume we’ll have all three cards for 5 years. We’ll set up a table with all the benefits and costs of each card for each aspect of the card for each year. Next, we’ll sum together all the cash flows for each year and discount them by our assumed discount rate.
Let’s start with the Chase Sapphire Preferred Card:
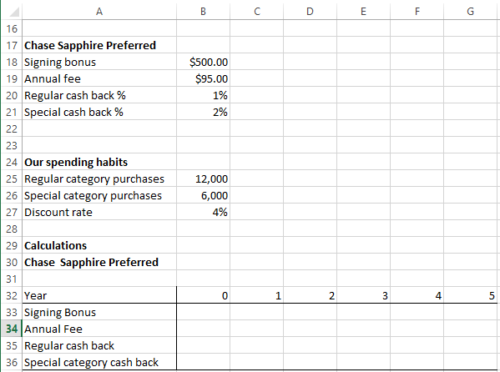
First, we’ll create our cash flows table with 6 years, from Year 0 (today) to Year 5. Then we’ll add in rows for each of the aspects of the card we will want to calculate:
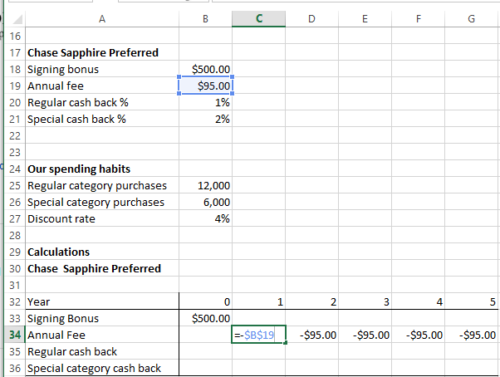
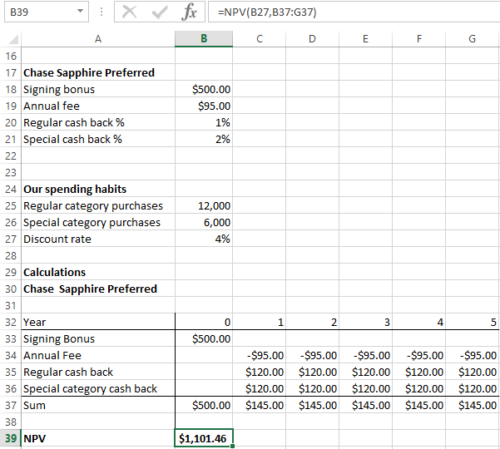
Next we’ll add formulas for the cash flows. The signing bonus gets brought into the Year 0 column with formulas “=A18”. The annual fee goes into each column Years 0 through 4 as “= –$A$19”, note the conditional references. We also delete the Year 0 annual fee as the website says it is waived in the first year.
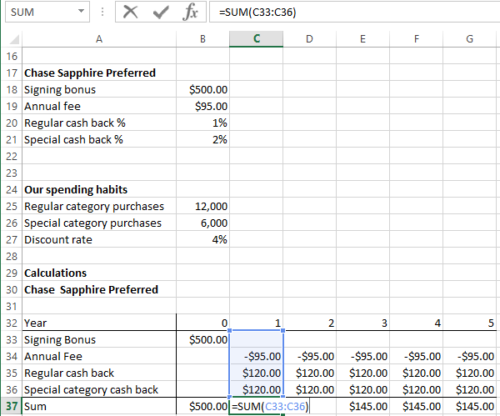
For the Regular cash back, we’ll take cell B20 and multiply by Cell B25 and for the Special category purchases, we’ll take cell B21 and multiply by cell B26. Then we’ll add a row to sum all the cash flows for each year.
Then we’ll use the NPV() function to calculate the Net Present Value of that stream of six cash flows for the Chase Sapphire Preferred Card at a 4% discount rate:
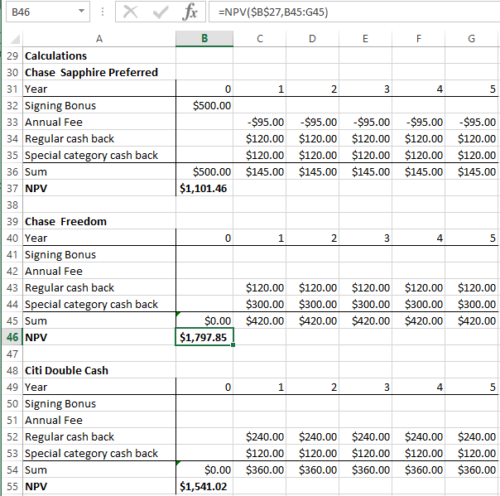
Repeat for the others, and we find that in our example, we should be using the Chase Freedom Card
Check out the Excel spreadsheet here: Use NPV to choose a credit card


