![]() Have you heard of kappa, a measure of inter-rater agreement? In this post, we’ll delve into this statistic and see how spreadsheets can help us calculate and understand it.
Have you heard of kappa, a measure of inter-rater agreement? In this post, we’ll delve into this statistic and see how spreadsheets can help us calculate and understand it.
Let’s say two spreadsheet gurus, Katie and Jon, rate 50 Spreadsheet Solving videos as to whether or not they are helpful or not (you can rate any of the videos too from youtube.com/spreadsheetsolving). In the table below, we see that both Katie and Jon agree that of 50 videos, 20 are helpful and 10 are not. In this case, the percentage agreement rate is 30/50 or 60%.
https://spreadsheetsolving.com/wp-content/uploads/2013/12/techsmithwor538c.png
But just how accurate is this 60% percentage agreement rate? Well – unfortunately, this measure doesn’t take into account the element of chance or random agreement. This is where kappa comes in! Kappa takes random agreement into account, so it is a more robust measure of inter-rater agreement than simple percentage agreement.
So, how do we calculate kappa, and how can spreadsheets help us? Kappa is a ratio consisting of 1) P(a), the probability of actual or observed agreement, which is 0.6 in the above example, and 2) P(e), the probability of expected agreement – or that which occurs by chance.
Kappa = P(a) – P(e)
1 – P(e)
Let’s calculate P(e), the probability of expected agreement. First, we figure out what the expected probability of both saying “Yes” and then add that to the expected probability of both saying “No.”
Our spreadsheet template can help us with this. Take a look at the sum figures to the right and to the bottom of the table. Here we see that Katie says “yes” a total of 25 out of 50 times (0.5) and Jon says “yes” a total of 35 out of 50 times (0.7). The product of these two numbers (0.5 x 0.7) represents the expected probability of both saying “Yes.” Once we follow the same process for computing the expected probability of both saying “No,” we can then easily compute P(e) and subsequently kappa.
In our example above, P(a) = 0.6 and P(e) = 0.5, so kappa = (0.6 – 0.5) / (1 – 0.5) = 0.2
Now, what does a 0.2 kappa mean? Just how do we interpret kappa? A kappa of 1 means that the observed agreement is fully accurate. A kappa of 0 means the observed agreement is entirely due to chance! How about a kappa between 0 and 1? There are a couple of guidelines, with one example below:
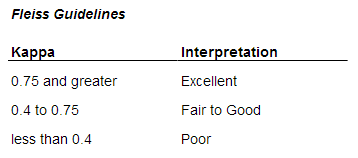
Ah – so it appears that while a 60% percentage agreement is fairly high, based on our low kappa measure, it may be that much of the agreement is due to chance!
To access the spreadsheet template, click here: Kappa and Spreadsheets
In our video below, we show another example of using spreadsheets to calculate kappa with an example of 2 judges deciding whether each of the 50 contestants should receive prizes.
Hi Amy,
Is there a measure, similar to ‘kappa’ when there are more raters involved?
Would appreciate if you could explain and/or point in the right direction