As we head into the heart of tax season, people (well, those who haven’t read Will Republican Tax Bill make you pay less taxes?) are taking stock of what the major changes are this year. One of the major differences is that the Tax Cuts and Jobs Act lowered the number of people subject to the AMT from 5.2 million to just 200,000.
But who were these 5.2 million people? Or how much income were they making that they would be subject to this tax?
The goal of our spreadsheet is to calculate taxes owed under the normal tax system, as compared to under the AMT system. Our spreadsheet calculates taxes owed under both systems for a variety of incomes and determines what income levels people owe more under the AMT system.
Spreadsheet Inputs
1. Assumptions: We assume a married couple with a house worth about 4x their income, a 4% mortgage rate, 1% property tax rate, and 2% donation to charity.
2. Income: This will be our main input. We also include mortgage interest, property taxes, charity, and family size.
3. Tax bracket and AMT rules
Spreadsheet Logic and Outputs
Luckily, we can reuse most of the logic from our post that calculates whether the Tax Cuts and Jobs Act will result in a family of four paying more or less taxes.
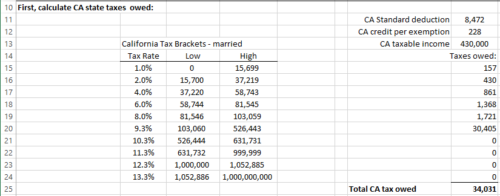
First, let’s calculate state taxes owed. For this example, let’s assume we live in a high tax state, California. A major difference between the AMT tax system and the normal tax system is that AMT does not allow for the deduction of state taxes and local property taxes. As such, the impact is greater on higher-state-tax states like California. The other differences between AMT and regular taxes are more esoteric (such as employee stock options). We use the same logic from our original post on calculating taxes with the inputted income and the California tax brackets.
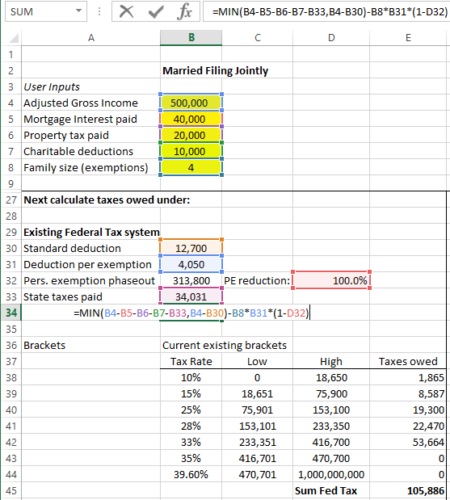
Next, we’ll calculate Federal Taxes owed under the old tax law from 2017:
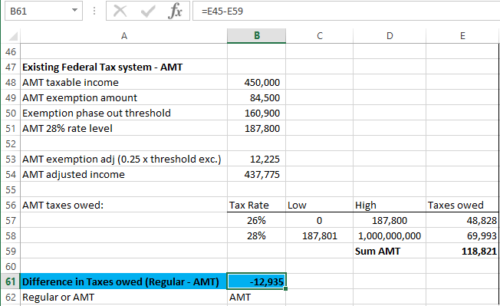
Then we calculate taxes owed under the AMT calculation, which takes out state and local taxes paid as deductions. Finally, we take the taxes owed under the regular system and subtract the AMT taxes owed. If we owe more under the AMT calculation, we are subject to the AMT:
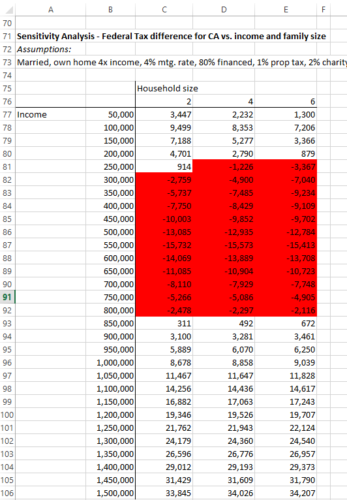
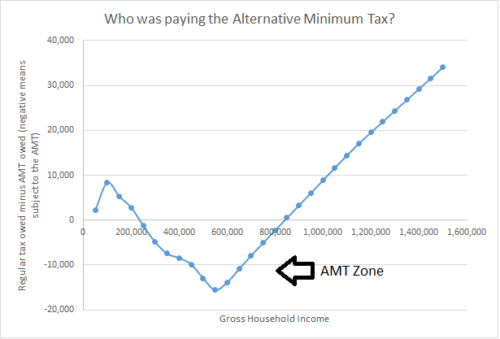
Now that we have the logic for one income, we can use a data table to plot whether someone is subject to AMT for a variety of different incomes:
And for the grand finale, here’s a more intuitive plot for a family of four. So if someone in California had said they owed AMT, you could translate that to meaning they were earning between $250k-$800k:
Check out the spreadsheet here: Who Pays the AMT?


