Seeking science experiment ideas? Want to conduct an experiment? Curious about hypothesis testing? Understanding how to design and test an effective experiment is an essential skill. Let’s investigate this research question: What is the impact of organic soil on a seedling’s height?
Spreadsheets are a platform to test an experiment or conduct a research study. With spreadsheets, we can collect & organize data, compute summary statistics, and even test hypotheses!
So, let’s begin our experiment with spreadsheets, statistics, seeds, & soil!
What is our Game Plan?
- Sampling design: Plant half of the seeds in organic soil; and the other half, non-organic. Let’s make sure this process is unbiased (more details on this below!)
- Data collection & quality check: Measure the height of each of the seedlings after 30 days from being planted, and record the data in a spreadsheet
- Analysis: Calculate and chart descriptive statistics
- Testing: Conduct inference test conditions and hypothesis testing
Below, we will delve into the first three steps: sampling design, data collection, and analysis. In our next post, we will determine whether conditions for inferences are met and conduct a 2 sample z-test of equal proportions test (which sounds scary, but we’ll master it together!)
Sampling Design
Two elements of a sample set are important: quality and quantity. An unbiased or random sampling method is ideal; and typically the larger the sample set, the better (more robust results!).
To set up an unbiased sampling design, we want to randomly assign the soil type (organic, non-organic) to the seedlings. One way to do this is to divide our 104 seeds into 2 groups: Group A would be those planted in organic soil, and Group B would be those planted in non-organic soil.
We will then give each seed a unique number (seedling ID number) from 1 to 104. Once labeled, let’s then use a coin toss to determine which soil type is given to the even-numbered seeds. The other soil type would then be given to the odd-number seeds.
<< Related: Create a coin toss in a spreadsheet >>
To improve the effectiveness of our experiment, let’s also try to reduce the effect of uncontrollable factors by keeping the amount of sunlight, water, temperature, and humidity consistent across the two groups.
Before we collect the data, let’s venture a guess: Do you think the average or typical height of an organically-grown seedling is higher than the non-organically-grown? Or, do you believe the height differences between the groups barely exist?
Data Collection & Quality Control
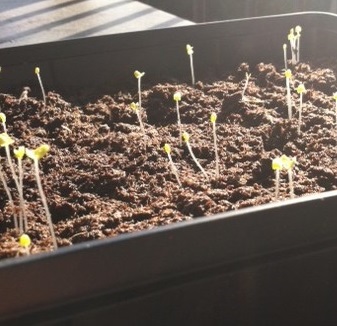
30 days have passed since we planted the seeds, and it’s time to collect the data! Now exactly what data will we need to track? 1) the seed’s ID number, 2) soil type, and 3) the seedling’s height after 30 days. Take a look at how our data collection table is organized in our spreadsheet. You’ll notice the odd-numbered seedlings are planted in non-organic soil; and even-numbered seedlings, organic soil (as assigned randomly by the coin toss).
[googleapps domain=”docs” dir=”spreadsheet/pub” query=”key=0ArU-OSCYb_YpdDdoS3B0Tmk1dGJ5Rmc0OWlGNFNCSUE&output=html&widget=true” width=”500″ height=”300″ /]
Note: To view the spreadsheet, go to the Resources section below and click on the link. To edit it, first save the spreadsheet on your Google drive.
To improve the accuracy in data collecting and measurement, consistency is key. For instance, think about how the seedlings’ height should be measured, such as a droopy seedling should be straightened before measuring it with a ruler. Then once you have a rule, apply it across all other seedlings. Finally, double-check that you have entered in the correct data: human error in data entry is sometimes inevitable but can be reduced by checking and reviewing your work!
Analysis
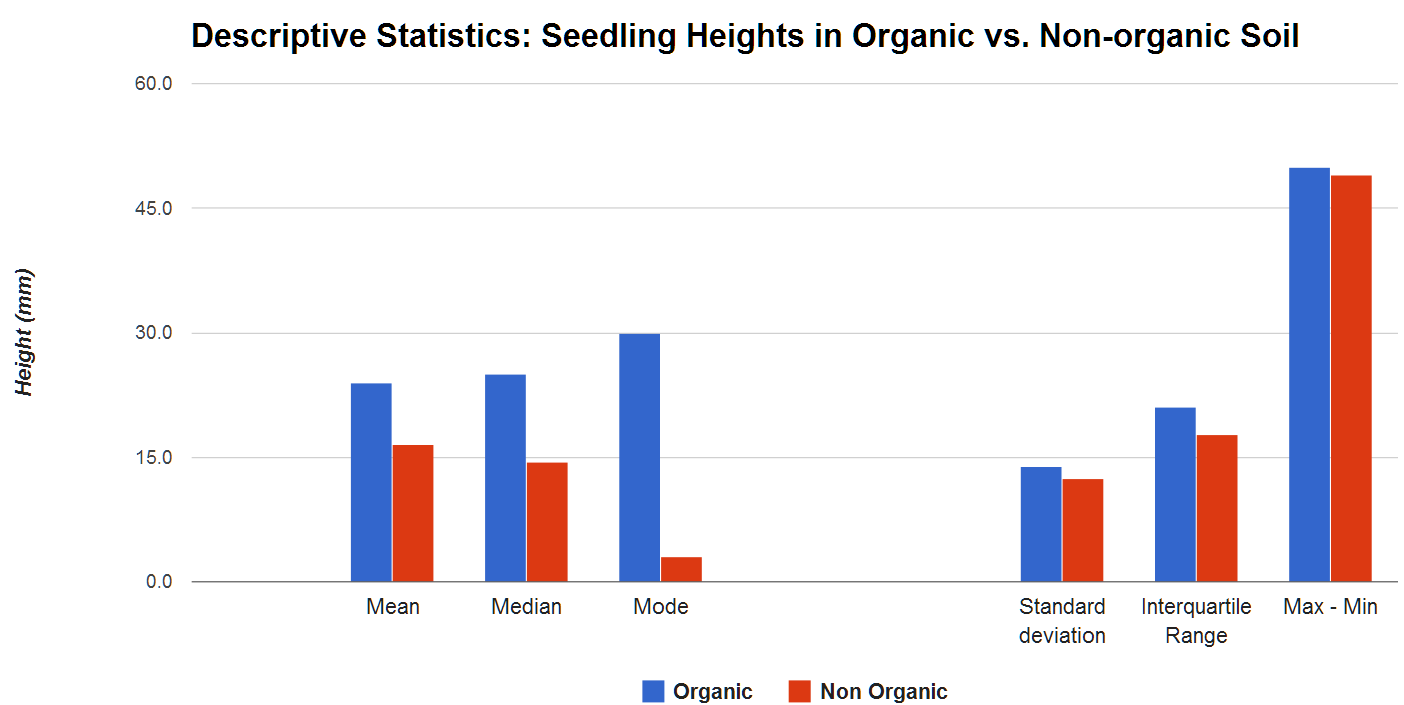
Let’s begin our analysis! Calculating descriptive statistics is an excellent way to understand the distribution of our data. For instance, we can calculate and compare the typical or average heights of a seedling in both groups (Organic and Non-organic), by computing the the mean, median, and mode – all measures of Central Tendency.
We can also investigate how far the data-points deviate from the typical value by calculating measures of dispersion, such as the standard deviation or interquartile range (IQR), the difference between the upper (75th) and lower (25th) quartiles. Finally, let’s examine the outliers of the dataset – such as the minimum and maximum values.
All these metrics can be computed in a spreadsheet using the appropriate functions. The video tutorials below will delve into each function in more depth:
- Mean, Median, and Mode (7:22 min)
- Standard Deviation (STDEV) (4:08 min)
- Percentiles (6:50 min)
- Minimum and Maximum (MIN & MAX) (7:10 min)
Visualizing data through a graph allows you to see immediately that across both the measures of Central tendency and dispersion metrics, the heights of the seedlings grown in organic soil are larger than those grown in non-organic soil.
More Resources:
- For the spreadsheet, please click and save on your Google drive: Experimental Design
- To create this chart type, view our video tutorial here: Column Chart (4:46 min)
- For a related video: Design and Conduct Experiments with Spreadsheets (7:46 min)
- For a related post: Hypothesis Testing with Spreadsheets: Part I
But, how do you set up the chart for the bar graph shown?
Hello, here are two links that explain how to create bar graphs. I hope you find them helpful. https://youtu.be/luj3_MVOU9s; https://youtu.be/W1KC7ugnadA.