What is the impact of organic soil on a seedling’s height? Will an organically-grown seedling be taller than one grown in non-organic soil? Armed with data, we’ll now tackle these questions by performing a statistical test in a spreadsheet!
To see how we our experimental design and data collection method, please see: www.spreadsheetsolving.com/posts/experiment-spreadsheet
What’s our Game Plan?
- Define the question
- Identify the statistical test
- Test assumptions and conditions
- Perform the hypothesis test
We will break up this topic into 2 posts. Here we will cover the first three steps. Because the last part is more involved, it will be covered in a sequel post, where we will also discuss the Central Limit Theorem, test-statistic, and p-value.
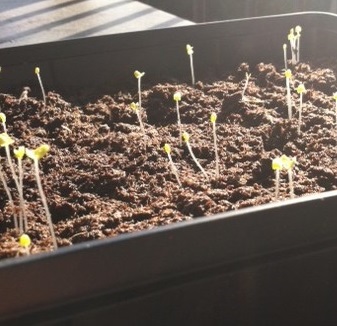
Let’s review our experiment design. We have 104 seeds and randomly assign half to be planted in organic soil (Group A or even-numbered seeds), and the other half in non-organic soil (Group B or odd-numbered seeds). Keeping all other factors constant (sunlight, water, humidity, etc), we measure the height of the seedlings in the two groups in 30 days. If the seeding’s height at the 30 day mark is greater than 25 mm, the seedling has reached a successful height.
Define the Question
Is the “height success rate” (i.e. proportion of seedlings with a height greater than 25 mm) for those grown in organic soil (Group A) significantly higher than that for those grown in the non-organic soil (Group B)?
Identify the Statistical Test
The appropriate test is the two sample z-test of equal proportions. This test is appropriate when comparing the success rates (proportions) for two populations. Because we have a large sample size (which we will confirm below), we can use the z-test rather than the t-test, which is applied when sample sizes are too small.
Below are a few symbols and terms that will come up in next two steps:
- n = number of seedings
- p = height success rate or the proportion of seedlings with a height greater than 25 mm.
We’ll use the subscripts A and B to denote Group A (Non-Organic) and Group B (Organic). So nA represents the number of non-organically seedlings, and pA is the proportion of seedlings with a height greater than 25 mm within group A (i.e. Group A’s height success rate)
Test Assumptions and Conditions
Remember – it is essential to test the assumptions and conditions appropriate for a specific test! For this test, there are two required conditions for inference.
- Independent random samples or random assignment
- Large sample sizes
Does our data-set pass the first condition? As we described in our Experimental Design post, we randomly assign the soil type to the seed using a toin coss. Therefore, there is random assignment, so the first condition is met!
To pass the second condition (large sample sizes), the number of success and the number of failures for both groups (Organically-grown and Non Organically-grown must be greater than or equal to 10). Shown mathematically, for each group, n x p ≥ 10 and n x (1 – p) ≥ 10.
So, all of the following must be true in order for the second condition to be met:
- nA x pA ≥ 10
- nA x (1 – pA) ≥ 10
- nB x pB ≥ 10
- nB x (1 – pB) ≥ 10
When we do this calculation in a spreadsheet (as shown in the yellow highlighted area), we find that all are greater than or equal to 10. So, the 2nd condition is met as well!
[googleapps domain=”docs” dir=”spreadsheet/pub” query=”key=0ArU-OSCYb_YpdEYtdF96RnFyQlJNSG5pMnNJb3VOcGc&output=html&widget=true” width=”640″ height=”384″ /]
Note: To view the spreadsheet, go to the Resources section below and click on the link. To edit it, first save the spreadsheet on your Google drive.
Now that we have verified that our data-set passes the conditions of inference, we can move on and conduct the hypothesis test! Stay tuned for our sequel post on Hypothesis Testing with Spreadsheets – Part 2.
Related Resources & Recommendations:
- Access and download this spreadsheet: Hypothesis Testing Spreadsheet
- Experimental Design: www.spreadsheetsolving.com/experiment-spreadsheet
- Video Tutorial: Design Experiments with Spreadsheets (7:46 min)
- Khan Academy: Hypothesis Testing with Two Samples