As mentioned before, we love browsing through the questions and answers on Quora. Every Quora session reveals financial success stories, inside views into jobs and companies, and some practical life advice.
One topic that comes up frequently is how much money one needs to stop working. That is a question that spreadsheets are well-suited to solve! Let’s build our Financial Freedom Spreadsheet Calculator.
Spreadsheet Inputs
- Current Age – The older you are, the less time you’ll need your money to last.
- How much money you have saved up – This pile of money is what will earn returns to support your lifestyle, since you won’t be working
- The annual return on your investments – More risk, more return…
- Your expenses – Retiring isn’t cheap! When you quit your job, you’ll have to find health and dental insurance, you’ll still have to pay taxes on your investment earnings, and your kids will still need to go to college (taking out student loans builds character?)… we also need to assume expense inflation. This site assumes the average annual expenditure is about $56,000, including taxes.
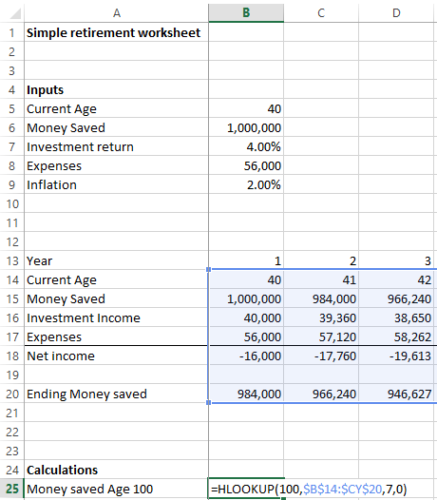
That’s pretty much it! Here’s our spreadsheet so far:
Spreadsheet Logic
Most of our logic will follow our post, Personal Finance Made Easy (with Spreadsheet Modeling!). We’ll forecast our investment income, expenses, and the balance of our money saved for each year going forward in each column in our spreadsheet. First, we’ll set up year 1 pulling in the inputs from our assumptions cells. The investment income each year will equal the money saved (B15) times our assumed investment return (b7), with a fixed reference on the cell B7:
Our net income is the investment income minus expenses, which we will add to our initial money saved balance to get the ending balance:
Now for year 2, the current age will increase by 1, the beginning money saved for year 2 is the ending money saved from year 1, investment income will be the same formula, and expenses will increase by inflation:
Now we can paste the formula from column C as far to the right as we need in order to simulate future years:
(This guy probably needs to keep working…)
Now that we have a projection of how much money we’ll have at each year in the future, we can add in a couple cells to ask interesting questions of our spreadsheet, like: Will I have enough money to last until I am 100 years old? We can use an HLOOKUP() to look up how much money is saved at age 100:
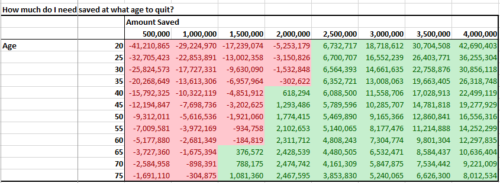
Finally, we can make use of a data table to see how much money we need to have saved at what age to stop working and cover expenses until we’re age 100:
Looks like if we have about 2.5 million, we’re generally in the clear, or $2 million after age 40. I’m realizing now that this doesn’t include social security and future one time college expenses, and a progressive tax formula, but I’ll leave those updates as an exercise for the reader.
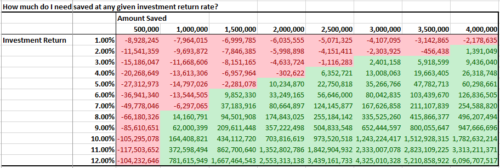
One more interesting data table – how does the ability to retire change with the assumed return on investments? We’ll assume the user is age 35.
Every percent of extra return makes a huge difference on the resulting asset balance at age 100. While the 35 year old could return with $2.5 million at 4%, they’d have to keep working until $4 million if they were only earning 2%. This is the downside of the current low interest rate environment and why for some people it is better for stocks to go down than up!
You can access the Excel spreadsheet here: How much money do you need to retire? Financial Freedom Calculator


