Spreadsheetsolving.com’s compilation of free, customizable, printable math worksheet generator spreadsheets

With summer starting, we thought it would be helpful to put all of our math worksheet generator spreadsheet posts into one (somewhat) organized list. We’ve been creating these spreadsheets over the past three years to help supplement math learning for our own kids.

Note that all of these spreadsheet generators are done in Microsoft Excel. In order to use the free Google Sheets software, you can download and save the .xlsx file onto your computer, go to Google Sheets, and then hit File->Import-> Upload, and select the file. It might need some minor formatting/fitting to print.

Math Worksheets

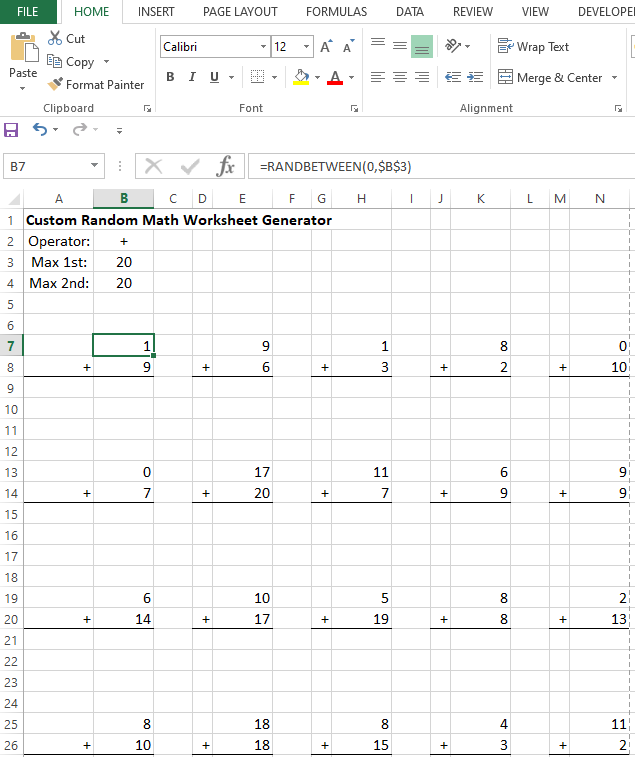
General Math Worksheet generator – allows parent to set the maximum number size, and what operation, generates a random math worksheet: random math worksheet

Fill in the blank Math Worksheet generator – similar to the prior math worksheet, but instead of figuring out the sum in a standard (addend + addend = sum) problem, one of the three is randomly blank and the student fills in the blank: Math Worksheet generator

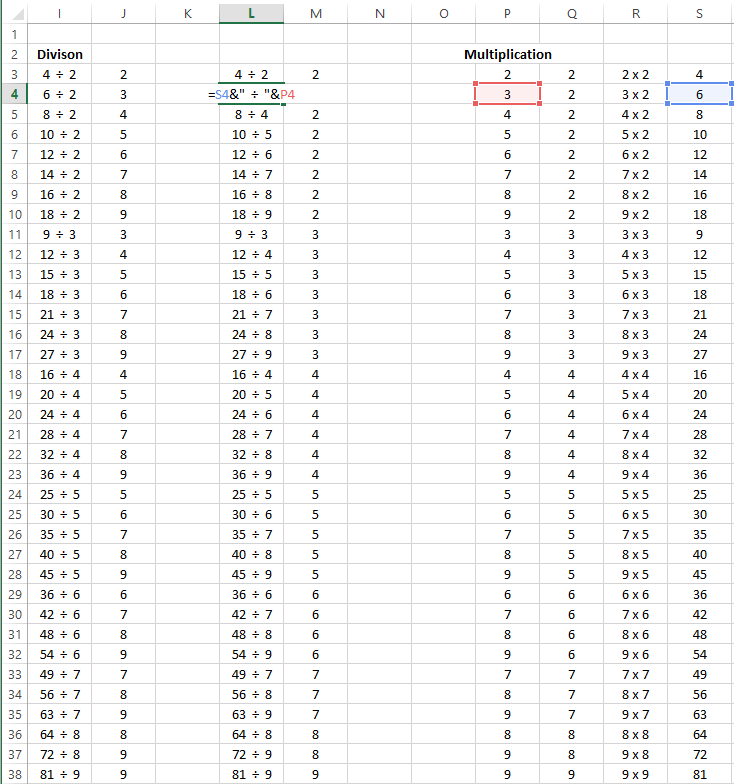
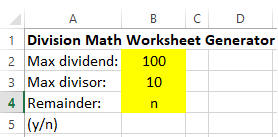
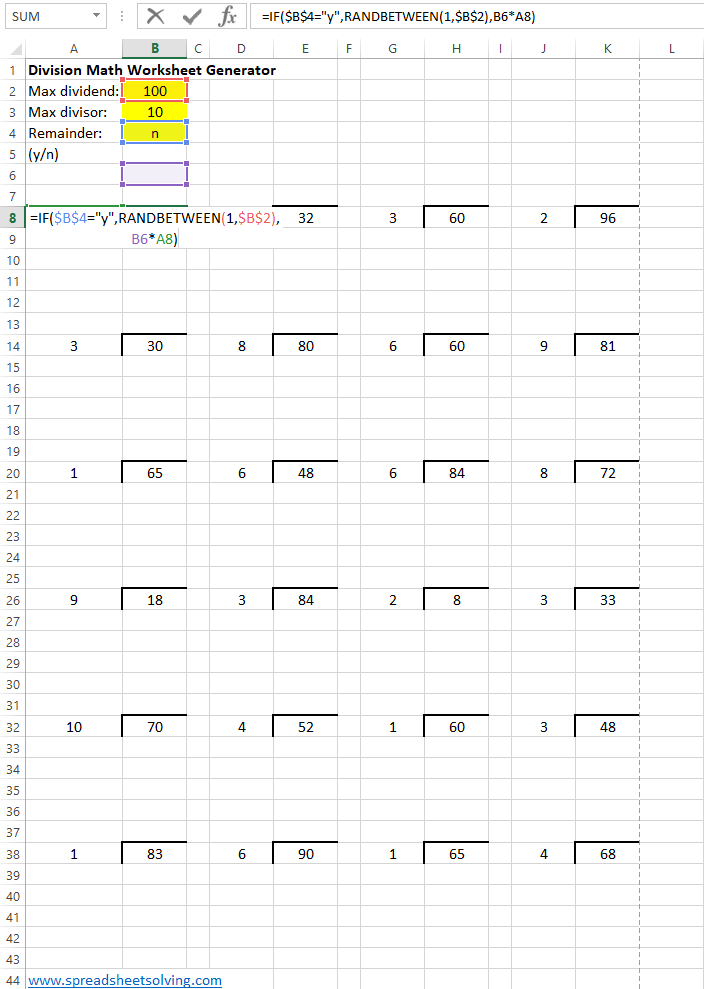
Division Math Worksheet generator – the logic and format for a division math worksheet generator was slightly different from the previous: Division Math Worksheet

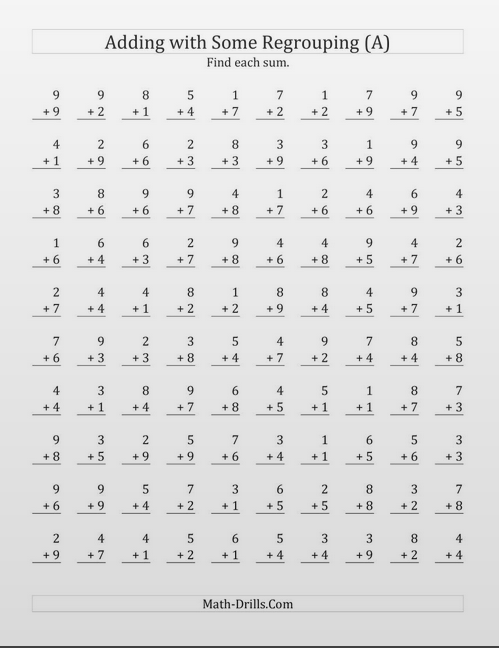
Addition and Subtraction Math Facts speed spreadsheet – similar to the general purpose spreadsheet but designed to be a speed test of addition and subtraction math facts: Addition and Subtraction Math Facts Speed Worksheet

Number sequence pattern math worksheet generator – here you have a sequence of numbers and can choose spacing, number size, number of blanks for the student to fill out: Number Sequence Pattern Math Worksheet

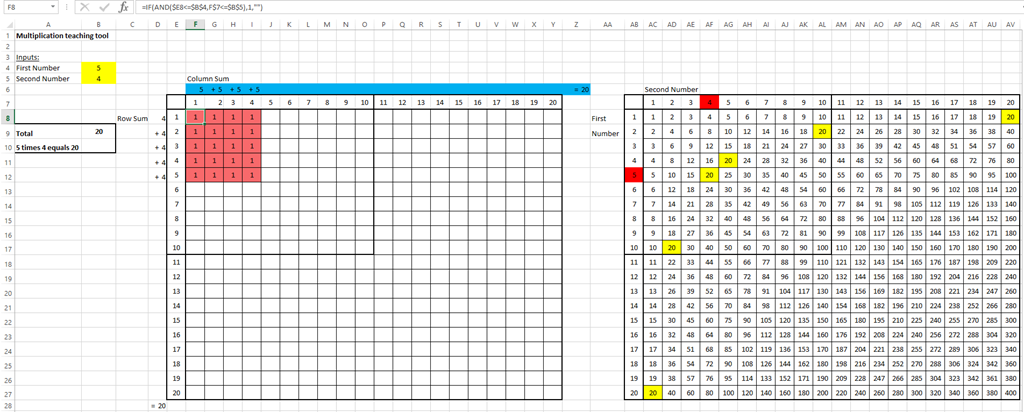
Math Dice style worksheet – students try use math functions on the randomly generated input numbers to get to the answer number: Math Dice Worksheet

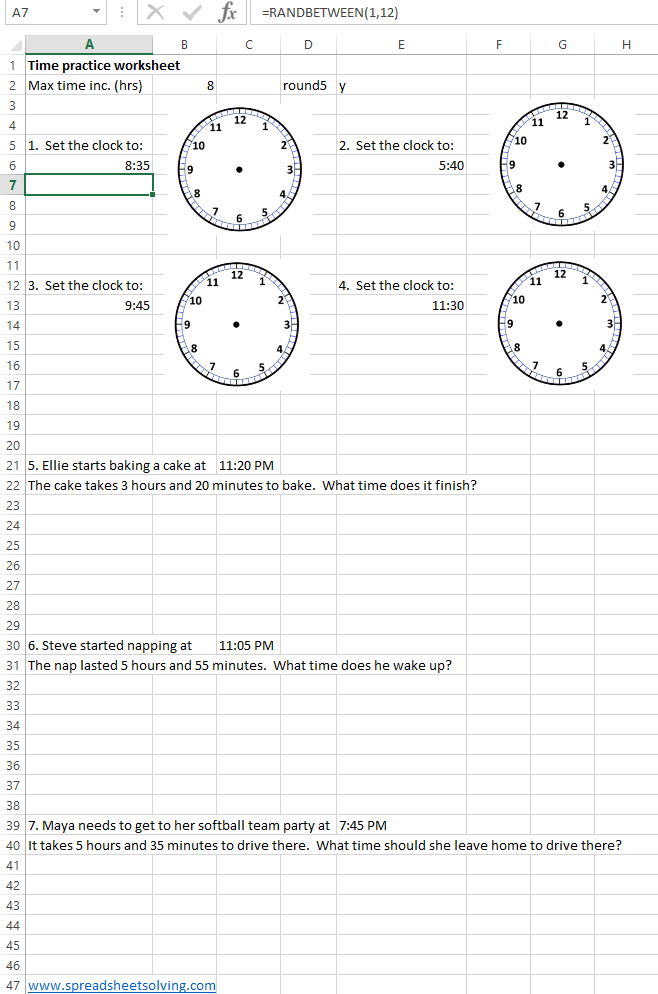
Practice with time math worksheet generator: Time Math Worksheet

Math word problem worksheet generator – this one is a bit crude, but perhaps someone could expand upon it: Math Word Problem Worksheet

Printable Flash Cards

General Purpose Flash Cards with user input and double sided printing: https://spreadsheetsolving.com/create-and-print-physical-flash-cards-with-this-microsoft-excel-template/

Addition and subtraction with math facts under 20 – Here we use our general purpose flash cards spreadsheet and enter in some math facts that students should have memorized: https://spreadsheetsolving.com/printable-math-facts-flash-cards-for-single-digit-addition-and-subtraction-with-carrying/

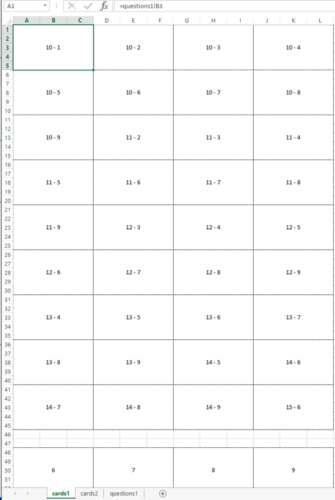
Multiplication Flash Cards: https://spreadsheetsolving.com/printable-multiplication-flash-cards-spreadsheet/

Division Flash Cards: https://spreadsheetsolving.com/printable-division-facts-flash-cards-spreadsheet/

Printable division facts flash cards spreadsheet

Today’s post is another extension of our series on flash cards. Since we made our multiplication flash cards last, the division flash cards were easy to make by reversing the multiplication answers:

We basically need double the flash cards since 20 divided by 5 and 20 divided by 4 are two different problems, whereas 4×5 and 5×4 are effectively the same.

Download the printable division flash cards spreadsheet here:

Printable Division Math Worksheet Generator Spreadsheet

Today we’ll build a dedicated division spreadsheet, where we set parameters for the problems and print an unlimited number of different division worksheets.

The inputs we’ll allow the user to enter are the maximum dividend (number to be divided) size, the maximum divisor, and whether or not we want to have the answers be able to have remainders.

So if the user selects yes or “y” for the remainder, the problem is relatively simple – we’ll have a random number for the answer between (1,100) for the dividend, and then a random number between (1,10) for the divisor.

If the user selects “n”, we’ll have a random number between (1,10) for the divisor, and then a random number between 1 and the max dividend/current divisor for the answer, then we’ll multiply the answer by the divisor to get the dividend.

Here’s how it looks like in full:

You can download the printable Microsoft Excel file here:

Printable time and clock math worksheet generator

Today’s printable math work sheet generator will center around the concept of time.

We’ll have two types of questions – one will ask the student to draw in the hands on a blank clock face for a random time. The other type of question will be a word problem that provides a start time and a time increment and asks the student to calculate the finish time. We would have loved to generate a random clock face time and ask what time it is but that turns out to be incredibly difficult in a spreadsheet.

To create the random times, we use the formula =RANDBETWEEN(1,12) for the hours, and then =RANDBETWEEN(0,59) for the minutes, then use the formula =TIME(hours, minutes, 0 seconds) for the time to display. We also added in some logic to allow for the times to round to 5’s if the user puts in a “y” in cell E2.

Check out the spreadsheet here:

Here’s how the final product looks:

Printable Math Facts flash cards for single digit addition and subtraction with carrying

As kids start to add and subtract bigger and bigger numbers, they will have to learn how to “carry” a 10 when adding two numbers that sum higher than 10, and “borrow” a 10 when subtracting a bigger number from a smaller number.

Today’s spreadsheet is an example case of our Printable Flash Cards Spreadsheet, where we put in all the addition and subtraction math facts that students will need to know quickly in order to do longer addition and subtraction problems that may need carrying and borrowing.

Check out the spreadsheet here: Printable Flash Cards

To print – print double sided, and flip on the long edge. There are two tabs (“cards1” and “cards2”) with 72 total flash cards to print. Wish we had some good advice for how to get your kids to actually practice with these…

Build a debt amortization spreadsheet

The topic of debt can lead to some heated debate within the personal finance community. While some shun it, others see the value in borrowing for certain things, such as a house, education, a new tv (okay maybe not the tv). While this isn’t exactly a personal finance website, we can use spreadsheets to help visualize how much future money will be needed to repay the loan.

Today’s spreadsheet will walk through how to create a debt amortization spreadsheet. It will take a user’s inputs such as the amount borrowed, interest rate, term, and spit out an interest and payment table.

Spreadsheet Inputs

  • The amount borrowed, which is also known as the “principal.” This is the total loan amount.
  • The annual interest rate, which is about 3% for mortgages these days.
  • The term, which is the number of months or years over which you are borrowing.
  • Whether you want to calculate your payments monthly or annually.

Here’s what we have so far:

Spreadsheet Calculations and Output

The real magic of calculating debt payments is in the finance function PMT(). This function will take your principal, interest rate, and term, and calculate the level amortizing periodic payment. Here’s how we use it in our spreadsheet to calculate the annual payment for our example mortgage:

Next we make a schedule of each of the payment periods, where we keep a running tally of the beginning principal owed, the interest paid, the principal paid, and the ending principal owed.

Now we fill out the table. The first beginning principal comes from cell B5, the payment comes from cell B12, the interest paid is calculated by multiplying the beginning principal with the interest rate, the principal paid is the difference between the payment and interest paid, and the ending principal is the beginning principal minus the ending principal. The next period’s beginning principal is the previous period’s ending principal.

Was that clear?

That’s pretty much it. Feel free to walk through it yourself. I added in the logic to make it flexible for monthly or annual calculations.

Excel: Debt Amortization Spreadsheet

Google Sheets: Debt Amortization Spreadsheet  (you can go to File –> Save a Copy to copy it to your Google Drive to edit it)

Teach kids to multiply with this spreadsheet

Today’s spreadsheet may help you introduce the concept of multiplication to your kids. Rather than walk through how to build the sheet step-by-step, we’ll include the download link and focus on how it works and how we tried (only semi-successfully with the bribe of TV) to use it.

Download the spreadsheet here: Multiplication Spreadsheet

How it Works

The spreadsheet includes 2 tables – a visualization grid and a traditional times-table.

First, input any two numbers (from 1 to 20) you wish to multiply. In our example, we entered 5 x 5 by putting 5 in the input cells B4 and B5 (highlighted in yellow). You can go as low as 1 x 1 and up to 20 x 20.

Now let’s explore the visualization grid (on the left) and the traditional times-table.

How to Use it
  • Visualization Grid: This grid is designed to help kids visualize the multiplication concept, by tapping into their understanding of counting and addition.

For our example, you will see a a 5 x 5 block of 25 pink cells. As a start, the kids can count the cells. Next, you can direct them to the blue row on top across the top of the grid. Here you can see that 5 x 5 is broken out into a more familiar addition problem of 5 + 5 + 5 + 5 +5 = 25.

  • Times-Table: On the right is a standard times table, where we tried to highlight the relevant square. So, in our example, you’ll see that the inputs 5 and 5 are highlighted in red and the answer, 25 is highlighted in yellow.

You’ll notice that if you try different combinations, you may see more than one cell in yellow. For instance, if we used 4 x 5, then every cell with 20 will be in yellow (this is a conditional formatting nightmare).

Let us know if you tried this sheet out with your kids or if have some elegant solution for formatting the right table!

Build a Printable Math Worksheet Generator Spreadsheet

Now two months into lockdown, we’re already scraping the bottom of the barrel when it comes to kids’ activities. No one wants to play our Math Dice Spreadsheet anymore. Why not torture educate them with a potentially never-ending stream of repetitive math reinforcement? Kidding aside, a mastery of arithmetic is a prerequisite for the (only slightly) more advanced problem solving examples that we provide here at spreadsheetsolving.com…

We basically want to create a spreadsheet that creates a bunch of random arithmetic problems that looks like this and can be printed:

Spreadsheet Inputs

  • What arithmetic operator we are practicing (+,-,x,/)
  • The largest possible value of the first number (one can adjust the difficulty by allowing more digits for each number you are working with.
  • The largest possible value of the second number.

Spreadsheet Outputs

This is another relatively simple spreadsheet – we’ll again use the randbetween() function to generate random numbers between 0 and the maximum values. The challenge with this spreadsheet is the formatting and making things look presentable. I’ll save you the gory details and just post the file here:

Download the Excel .xls file by clicking here: Custom Math Worksheet Generator

For another spreadsheet that combines both addition and subtraction on the same sheet, click here: Custom Math Worksheet Generator 2

A simple scoreboard spreadsheet for lockdown Zoom games

Here’s a simple spreadsheet that serves as a handy scoreboard to keep track of who is winning your Zoom games. While there’s not much to it, feel free to save a copy to your Google Docs folder. We’ve been playing some Jackbox Party Pack, which keeps score for you, but I could see how there could be other situations (competitive Zoom rock paper scissors?) where you could have your own scoreboard.

Anyways, basically the only calculations involved are the Sum() and Rank() functions. I added in a little bit of formatting (freezing at Row 9 if the game goes many rounds, and shading every other row).

Stay Safe and enjoy!

Spreadsheet is attached here: Simple Scoreboard

(Remember to go to File –> Save a Copy to download a copy to your own Google Sheets Drive that you can Edit).

Build a Net Worth Estimator Spreadsheet

We’ve just hit week 4 of coronavirus-related working-from-home. Hope everyone is staying safe and staying home if you are able. One thing I’m starting to miss is workplace banter – conversations about TV shows, sports, and celebrity net worths. This post was also inspired by a blog post from Root of Good detailing their net worth progression between 2004 and 2014. In any case, it seems the fascination/financial voyeurism of guessing people’s net worth is widespread, and we’ve built a spreadsheet for the job.

Spreadsheet Inputs

So, here we have another “essence of modeling” problem. We could make our spreadsheet hopelessly complicated and precise with detailed inputs for tax rates, investment allocation, debt, and spending, etc. I’m making the choice to make the spreadsheet be as simple as possible. Our 6 inputs will be:

  • The year you started working and your starting income. (Or check glassdoor.com to estimate someone else’s).
  • Your initial net worth – some people have a head start
  • Your income now – I’m going to assume that you’ve worked every year and your income has gone up (hopefully) in a straight line fashion to today.
  • The percentage of your gross salary you saved each year. The Root of Good appears to have saved around 70-80% of their income. It appears the national average is closer to 8%.
  • How aggressively you invested your savings (%stocks vs %cash). I’ve input the annual returns from stocks using this helpful data from slickcharts

We’ll go with Google Sheets for today’s spreadsheet, and just for fun, let’s try to replicate the Root of Good’s numbers:

Spreadsheet calculations and output

In our spreadsheet, we begin with our inputs for the first year. Each year we take the starting net worth, add the income net of expenses to it. We then look up what stocks returned that year and calculate the investment return from their beginning net worth. We add it all together to get the ending net worth for the year:

For each future year, we’ll increase the year by one (until we get to the current year), increase income in a straight line between their current and final income, and add the relevant investment return:

Then we can paste in the formulas from column C into the right columns:

Our spreadsheet would have predicted Root of Good’s net worth in 2014 was $1.48 million. Their post indicated it was $1.35 million. Pretty close for just the few inputs that we used!

Check out the link to our net worth estimator spreadsheet here to play with it yourself. Remember, you can save a copy to your own Google Drive by going to File –> Make a Copy.

It would be a fun exercise if you (anonymously) posted in the comments what the spreadsheet calculated for you versus your actual net worth. That data would be tailor-made for an xy-scatter plot.

A 2019 update of our House Rent vs Buy IRR Spreadsheet

This post will be a quick update to our original buy vs. rent spreadsheet post, given changes in the economics of housing due to the Tax Cuts and Jobs Act from late 2017. First, a quick review of how the original sheet worked: we had taken the main costs and benefits of home ownership as inputs and calculated what IRR you effectively were earning on your down payment:

Major changes to the spreadsheet include:

1. Mortgage interest is now only deductible for the first $750k. We adjust the formula for the tax benefit of the mortgage interest deduction to include an if statement that checks if the mortgage balance is above $750k. If so, the tax benefit is limited to deducting interest on the $750k.

2. The value of the property tax deduction is likely lower due to the cap on state, local, and property tax deductions at $10k.

3. The standard deduction is much higher: $24k for a married couple for 2019 versus $12,700 in 2017. This makes it more likely people end up just taking the standard deduction, which means the property tax deduction is not used, or could make the part of the mortgage interest that is under the $24k cap not useful.

We’ll work on both of these problems together, with some simplifying assumptions. First, we’ll ask users to input their income, average tax rate, and other federal tax deduction items (charitable giving, etc), and whether they are married. This will give a sense of whether they were already at the $10k SALT cap, and therefore implies the property tax deduction wouldn’t be worth anything to them. Also, only the portion of the mortgage interest that puts the user above the standard deduction is worth anything, so we add that logic in as well:

(36 hours later…)

Okay, we kept running into complicating factors, and the formulas we’re now using for the mortgage and property tax deductions have gotten very convoluted (check out the formula below that calculates what portion of the mortgage interest deduction is not really a marginal benefit because it was needed to put you over the standard deduction). Here’s what we have, rather than try to explain it step by step, try walking through it yourself, or if you have a better solution, let us know!

Check out the spreadsheet here: home buy vs rent complex 2019 update

How much “should” house prices be down in California?

An application of our IRR based Buy vs Rent spreadsheet

Based on a casual look at the economy, things are going pretty well –  unemployment is down and GDP growth is strong. So it would seem to make sense that U.S. home prices are up about 3.5% so far this year, right?

But if we rewind the clock by a year, many of the economic factors involved in owning a home in the U.S. have gone the wrong way:

Let’s use a spreadsheet to compare the values of three hypothetical houses in California – today versus from one year ago – based on changes in mortgage rates, marginal tax rates, and mortgage interest deductibility requirements.  Continue reading “How much “should” house prices be down in California?”