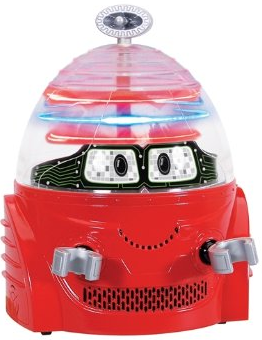
 No robot or machinery is consistently perfect. Glitches might occur with overuse, or the environment is unsuitable. While achieving a perfectly functioning robot is a noteworthy goal, it may not be realistic. So, what level of error or tolerance level would you be willing to accept? Let’s discover how to use spreadsheets as a tool for understanding and calculating measurement error.
How do we figure out accurate your robot is? Accuracy describes how close a measurement is to its actual or acceptable value. With spreadsheets, we can assess accuracy by measuring absolute and relative errors.
Why spreadsheets? Spreadsheets offer us the following benefits, by serving as
- a database for organizing and tracking data
- an instrument for efficient calculations
- most importantly, a tool for understanding and solving problems
[googleapps domain=”docs” dir=”spreadsheet/pub” query=”key=0ArU-OSCYb_YpdC1LWFV3TW0tVzJNMUtMVWJqelVGeEE&output=html&widget=true” width=”640″ height=”300″ /]
Absolute and Relative Error
Let’s imagine our robot creates wheels. In a perfect world, all the wheels our robot produces have an Optimal or Actual diameter of 30 cm (or about 11.8 inches). But in reality, the diameter can deviate from the optimal. These are questions we want to understand: What is the absolute and relative error of each wheel? Did the wheel pass our acceptable range (i.e. a range around the optimal level that we can tolerate)? What is the overall defective rate?
In our testing lab, our robot produces 100 sample wheels. We diligently measure and record the diameters of each wheel in Column B of our spreadsheet. At this point, we are ready to calculate the absolute and relative error of each wheel by setting up a formula.
How do we calculate the Absolute Error and Relative Error?
Absolute Error = |Measured Value – Actual Value|
Relative Error = Absolute Error / Actual Value
In our example, the Actual or Optimal Value is 30 cm. Note that given its definition, the Absolute Value will always take on a positive value (because of the absolute value sign) in the same units of the original measurement (cm). Relative errors measurements are written as a percentage.
Based on the definitions of both error measurements, we can set up the functions. Once we set it up properly once, we can then easily copy and paste the formulas across the remaining 99 wheel measurements.
Band of Tolerance and Defective Rate
Our band of acceptance or tolerance is 1.5% greater than and less than 30 cm, or 29.6 cm to 30.5 cm. That is, if a wheel diameter falls within this range, we can still accept the wheel. In other words, that wheel passed our standards. As you see, we can affect how many wheels pass or fail by modifying how tight or loose our band of acceptance or tolerance is!
Finally, once we determine whether each wheel passes or fails, we can then look in aggregate across the sample set and see what the overall defective rate is.
Spreadsheet Challenge
Try to figure out how to set up the formulas for the absolute error and relative error. Next, also solve how to create a formula that will indicate whether the wheel passed the standard. Finally, determine how many wheels are defective (both in a number and as a percentage of the total sample set).
Hint: While there are various ways to set up the formulas, we used the following functions: ABS, IF, and COUNTIF. Click on each to view a video tutorial.
Assess, Draw Conclusions, and Consider Alternatives
Finally and very importantly, assess, assess, and assess! Once the spreadsheet is set up and the error measurements determined, let’s understand and ask ourselves: How accurate is our robot? Does a 16% defective rate in our sample warrant concern? Or should the robot be taken off the production line and repaired?
Often we find a host of questions to consider pops up. For instance: What might be causing this defective rate? Is the robot not calibrated properly? Is it operating in unfavorable conditions (too cold, too hot)? How accurate were our measures of the diameters? Is there a way to minimize human error? What other factors are we potentially missing?
Resources
- Related Spreadsheet: Measurement Errors
