We have a set of data and want to understand its characteristics. A great starting point is to measure the central or typical value and the dispersion around that value. In this post, we will focus on the latter – specifically a standard measure of spread known as the sample standard deviation!
What is the sample standard deviation, and how do we calculate it?
Our goal is to build some intuition behind what the standard deviation is and how it is calculated. Afterwards, we’ll introduce a function (STDEV) that can compute the standard deviation in a spreadsheet. Please apply spreadsheet functions only after a thorough understanding of the concepts! Spreadsheets can be especially useful when we have large data-sets, and the calculation becomes unwieldy and time-consuming. That said, we believe a fundamental understanding of statistical concepts should come before applying any spreadsheet function.
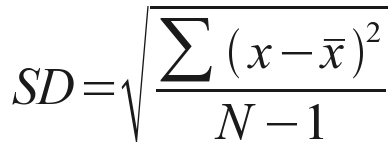
So, let’s begin! Take a look at the formula for a Standard Deviation below:
The standard deviation is a measure of the spread from the mean. We can think of it as the average distance of the data is from the mean. So, the first step is to calculate the mean, which can be done by summing up the sample values and dividing it by the number of values (In a spreadsheet, you can also use the AVERAGE function).
<Related: Averages Matter: Mean, Median, and Mode>
We then subtract the mean calculated earlier from each sample value and square the differences. Why do we square the differences?
By squaring the differences, we will always have a positive value so that summing them up will not result in a zero. Also, squaring has the added benefit of magnifying larger differences or emphasizing the extremes. A drawback of squaring, however, is that unlike the original data, the units are now squared.
Now that we have the sum of the differences (of the means), we can divide this by the total number of values less one (or N-1), which then results in the standard variance. To understand the intuition behind dividing by N -1, please view this video by Khan Academy: Review and Intuition why we divide by n-1 for the unbiased sample variance.
Our final step is to take the square root of the above value. Why is that done? As mentioned above, because we squared the differences, the resulting value would no longer be in the same units as the original sample values. Fortunately, we can easily return to the original unit by taking the square root.
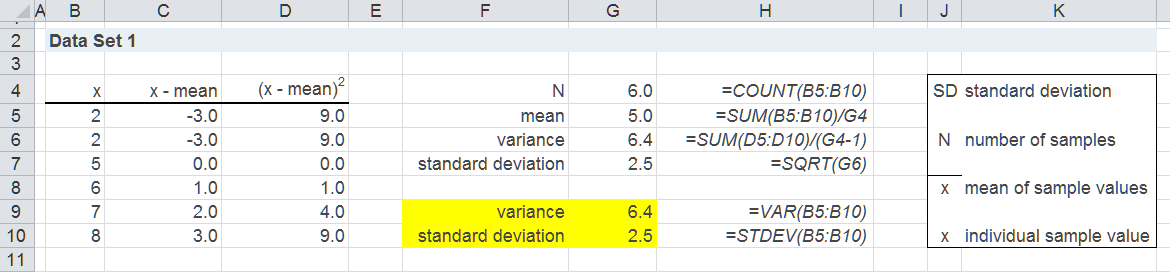
In our spreadsheet below, we have 6 sample values all listed in column B. Here you will see how we can calculate the sample standard deviation based on its definition or use the spreadsheet function: STDEV. Both result in the same outcome.
As shown below, we compute the mean, take the differences of the sample values and the mean (column C), and then square those differences (column D). Based on these, we can then solve what the standard deviation is in cell G7. As we would expect, this calculation results in the same output as that generated using the STDEV function, shown in cell G10.
To use the STDEV function, enter an “equal sign” in the cell, followed by STDEV, and then highlight the range of cells from which you’d like to calculate the standard deviation. In the example below, the range of cells is found in Column B, specifically in rows 5 to 10. Putting all this together, the formula would be =STDEV(B5:B10).
A quick note about the spreadsheet image below: You can see how we set up the formulas in Column G by looking directly to the right (Column H). The box of terms (Columns J and K) represent a legend, defining the components of the Standard Deviation formula, shown at the top of this post.
For a video tutorial on the standard deviation and variance functions and how they are applied with movie data, please see the 4-minute video below.
I almost never leave comments, but i did a few searching and wound up
here Breaking it down: Sample Standard Deviation | Spreadsheet Solving.
And I do have a couple of questions for you if it’s allright.
Is it just me or does it look as if like a few of the remarks look as if they
are left by brain dead folks? 😛 And, if you are posting at additional places,
I’d like to follow everything fresh you have to post.
Could you list of every one of your social pages
like your linkedin profile, Facebook page or twitter feed?
Thanks for your interest. If you go to the bottom of our home page (www.spreadsheetsolving.com), you can find links to our LinkedIn profile, Facebook page, and twitter feed. Thanks again!
I am not sure where you are getting your information, but great topic.
I needs to spend some time learning much more or understanding more.
Thanks for fantastic info I was looking for this info for my mission.