The average value is very desirable in the world of statistics! Known as the central tendency, averages provide a way to understand the characteristics of a broad set of data. What are the different measures of central tendency? How can we calculate them? Let’s explore this below!
Why should you care about measures of average? In a data set, understanding the typical value provides you with a piece of valuable information. For instance, the typical value is a way to describe or characterize any data set you are curious about, whether it be in sports (What is the average number of free-throws LeBron James makes in a game?), shopping (What is the average amount I save by shopping at store x vs. store y?), or entertainment (What is the average rating of a restaurant or a movie?).
A quick aside: all Central Tendency method can be calculated through various methods, such as pencil and paper, calculator, or spreadsheet. That said, when the set of numbers is especially large and overwhelming, spreadsheets can be an efficient and effective tool. Regardless of the calculation method, we believe that understanding the concept should be first priority!
Below is a 7-minute video tutorial on the Mean, Median, and Mode
Arithmetic and Geometric Mean
The arithmetic mean and geometric mean are two measures of Central Tendency. The arithmetic mean is the most commonly-used measure of central tendency. Often, this term is used interchangeably with the word “average.” It is calculated by adding up all the values in the data set and dividing it by the number of values in the data set.
The arithmetic mean is straight-forward to calculate, easy to work with, and commonly-used. However, because all values in the data set are incorporated in the calculation of the mean, one drawback of this measure is that it can be influenced by extreme values or outliers. So, if the distribution is skewed, the arithmetic mean may not necessarily be very representative of the typical value.
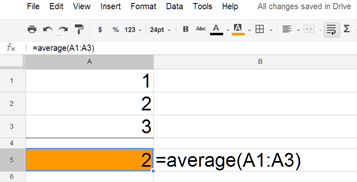
To calculate it in a spreadsheet, begin with the equal sign followed by the function “average.” Then capture the data range of which you’d like the calculate the arithmetic mean of. As an example, let’s say we have a small data set, consisting of 1, 2, and 3. The arithmetic mean is equal to 2, calculated as (1+2+3) / 3, as shown below.
Rather than take the sum of the numbers, the geometric mean multiplies the numbers, and then takes the nth root of the product. Based on how it is defined, the geometric mean only applies to non-negative numbers. Often, this metric is applied to numbers that are exponential in nature, such as compounding nature of stock returns or population growth. To calculate the geometric mean in a spreadsheet, use the GEOMEAN function and capture the data-range.
<< See a related 3:30 min video on the GEOMEAN >>
Median
The median is the middle value of the data set after all the values are sorted from lowest to highest. As a result, there will be an equal number of values before and after the median. Unlike the arithmetic mean, the median is not impacted by outliers, so for distributions that are heavily skewed, the median may be the preferred measure of central tendency.
If there are an even number of data points in the set, the median is calculated as the arithmetic mean of the 2 middle values. In spreadsheets, it doesn’t matter whether you have an even or odd number of values in your data-set. The spreadsheet calculates the median the same way: simply use the function median and reference the range of cells from which you’d like to calculate the median! See the example below:

Mode
The mode is the most frequently occurring value in a data set. In a spreadsheet, use the mode function followed the range of cells making up your data set. If there is no recurring value, the mode doesn’t exist, so the spreadsheet output would be an error or “#NA.” If your data-set has more than a single mode (for instance, 1, 1, 2, 3, 3), this data-set is multi-modal. However, please note that a limitation of spreadsheets is that they will not capture multiple modes.

Nearly every time we analyze data, we calculate a measure of Central Tendency – whether it be the mean, median, or mode. You now have a basic understanding of the concepts and knowledge of how to compute them!
Resources & Applications
- Movie Data Analysis Application: https://spreadsheetsolving.com/analyze-movie-data/
- Excellent background by Khan Academy: Central Tendency
- Sample Standard Deviation: https://spreadsheetsolving.com/sample-standard-deviation/