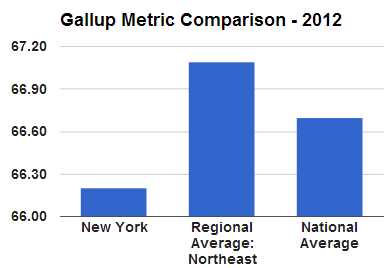
Is the typical New Yorkers’ overall “well-being” better than that of the national average? Nope! How did we quickly conclude this? Check out the graph to the right. Data visualization is an effective (and fun) way to understand information!
Too much information can be overwhelming. But there are ways to channel the desired data and convey it in a way that makes it quick and easy to understand. Let’s discover the power of data visualization by creating a flexible, automatic tool shown below. To see this tool live in action, see our 2-minute video below:

