What is the probability of rolling any pair of numbers with two dice? Let’s first solve this and then confirm our calculated probability by simulating 500 dice rolls with a spreadsheet! In this post, we will focus on understanding basic probability concepts and then discover how with spreadsheets, we can actually see whether our calculated probability holds true!
Probability is the study of chance. We use the laws of probability to understand the chances of successful outcomes in our uncertain world. When approached with a question about probability, a good first step is to consider all possible results of observing the outcomes of a chance event. This collection of all these outcomes is also known as the sample space.
For instance, let’s consider the chance event of tossing a coin. The sample space of a random coin toss is Heads and Tails.
<< Related: Coin Flipping Life Experiment >>
In the case of a throw of a single dice, the sample space is as follows: 1, 2, 3, 4, 5, and 6. When we consider the sample space for a pair of dice, the sample space expands by six-fold. Take a look at the sample space below:
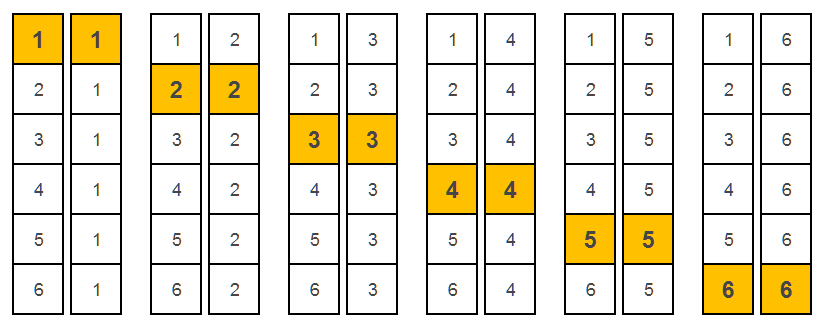
The sample space consists of 36 outcomes. Each outcome is equally likely, so the probability of each is 1/36. As shown above, we highlighted all those outcomes that are pairs, which occur 6 times. As such, the probability of rolling a pair of the same numbers is 6 x 1/36 or 6/36, which is equal to 1/6.
Another way to think about this is as follows. The probability of Dice 1 rolling a 1 is 1/6. The probability of Dice 2 rolling a 1 is also 1/6. As such, the probability of both dice (dice 1 and Dice 2) rolling a 1 is 1/36, calculated as 1/6 x 1/6. This probability of both dice rolling a 2 or 3 or 4 or 5 or 6 is also 1/36. So, the probability of rolling any pair can be computed as the sum of 1/36 + 1/36 + 1/36 + 1/36 +1/36 + 1/36 = 6/36 = 1/6.
Does this really hold true? If we rolled the dice a very large number of time, can we expect this outcome would occur 1/6 time in the long run? Let’s use spreadsheets to find out!
In our spreadsheet below, we have two dice (an orange and a black one). We simulate random dice rolls 500 times and then make a note in the third column every time a pair of the same numbers is achieved! In the blue table to the right, we notice that indeed the observed probability is very close to our calculated probability of 1/6.
[googleapps domain=”docs” dir=”spreadsheet/pub” query=”key=0ArU-OSCYb_YpdFlGbUFuVFRUNU5zWUNhVnlfOGI4dFE&output=html&widget=true” width=”640″ height=”384″ /]
How did we simulate the dice roll? The RANDBET function allowed us to do just that! Once we set up the function for 1 pair of dice, we easily copied and pasted it 499 more times to simulate 500 times. As long as we add more rows to the spreadsheet, we could simulate as many dice rolls as we wish!
For a 3-minute video tutorial on the RANDBET function, please see: Randomize (RANDBET, RAND)
Finally, for a video tutorial on dice simulations in spreadsheets, please view the 7-minute video below: