
When asked which child she adores most, my mom would remark without hesitation, “Sushi is my favorite.” Sushi is an adorable 7-year-old schnauzer. As many may relate, pets are a part of the family, with a few lucky ones elevated to “favorite child” status.
We love and pamper our pets even if doing so can be expensive. According to the American Pet Products Association (APPA), the average basic annual expense of caring for a dog is over $1,500, which includes expenses related to vet visits, food, boarding, and grooming, among others. Assuming your beloved pet leads a full life of 12 years, it could cost a minimum of $18,000 (which doesn’t include inflation!). Of course, the love we receive from our four-legged friends cannot be quantified and their companionship is immeasurable.
Yet, do we spend less on our pets during a recession? Over the last 10 years, we’ve lived through the ups and downs of the US stock market along with the aftermath of the 2000 tech bubble and the 2007-2008 housing and financial system collapse. In 2002 and 2008, the S&P 500 dropped by 22% and 37%, respectively.
As the stock market slumped, did Americans’ spending on pets also plummet or did they remain resilient?
How can we measure this? Let’s look at total US pet industry spending data from the American Pet Products Association (APPA), which estimates the total amount that Americans have spent in the pet industry on an annual basis since 2001.
[googleapps domain=”docs” dir=”spreadsheet/pub” query=”key=0ArU-OSCYb_YpdEJLWk9CS1hQTkNHTFBqeW1jUm9oMXc&output=html&widget=true” width=”500″ height=”300″ /]
Note: To view the spreadsheet, go to the Resources section below and click on the link. To edit it, first save the spreadsheet on your Google drive.
As shown in the chart above, the yellow highlighted column shows the spending data provided by the APPA. What is the annual spending growth rate? Or, in other words, on a percentage basis, how much has spending changed year-over-year?
This question is important in understanding spending pattern changes over time, which we can then compare against another measure – such as US stock market returns. To calculate pet spending annual growth, we take the difference of the two year’s spending level and divide this figure by the previous year’s spending level. This is equivalent to dividing the current spending level by the previous year’s level and then subtracting by 1. Try to calculate this on your own first before taking a look at the second column (% US Pet Expenditure Growth) in the embedded spreadsheet above.
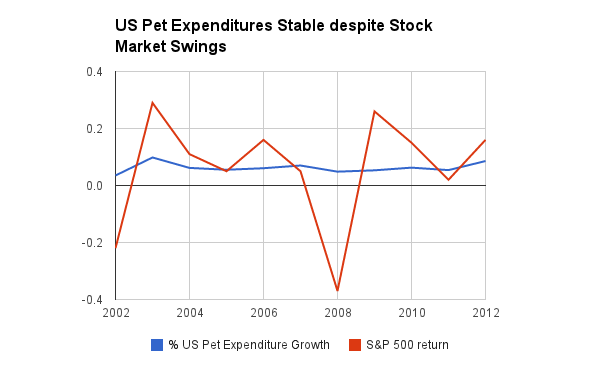
Now that we have calculated annual spending rates, let’s compare them to annual stock market returns. A line graph of the annual spending growth and stock market changes provide a neat visual representation for this type of data. Take a look below. We find that regardless of large changes in the stock market, Americans’ spending on pets have remained steady. We love our pets.
Resources:
- Sample spreadsheet: U.S. Spending on Pets
- Video Tutorial: How to create a Line Graph in a Spreadsheet