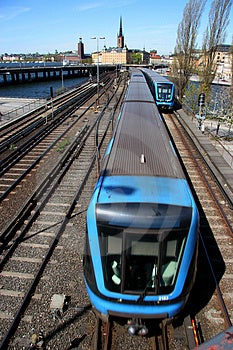
The Metropolitan Transportation Authority (MTA) recently published an observational study of subway rider seating behavior. Collecting data over three weeks in late winter 2012, the researchers published their findings on rider seating preferences in a draft report: who finds seats when the train is crowded? Do standing riders prefer vertical bars or graspable handles? Which seat type do sitting riders take: seats near a door or bench spots?
Based on some of the data from the report, let’s create visuals – charts that offer us a glimpse into some questions:
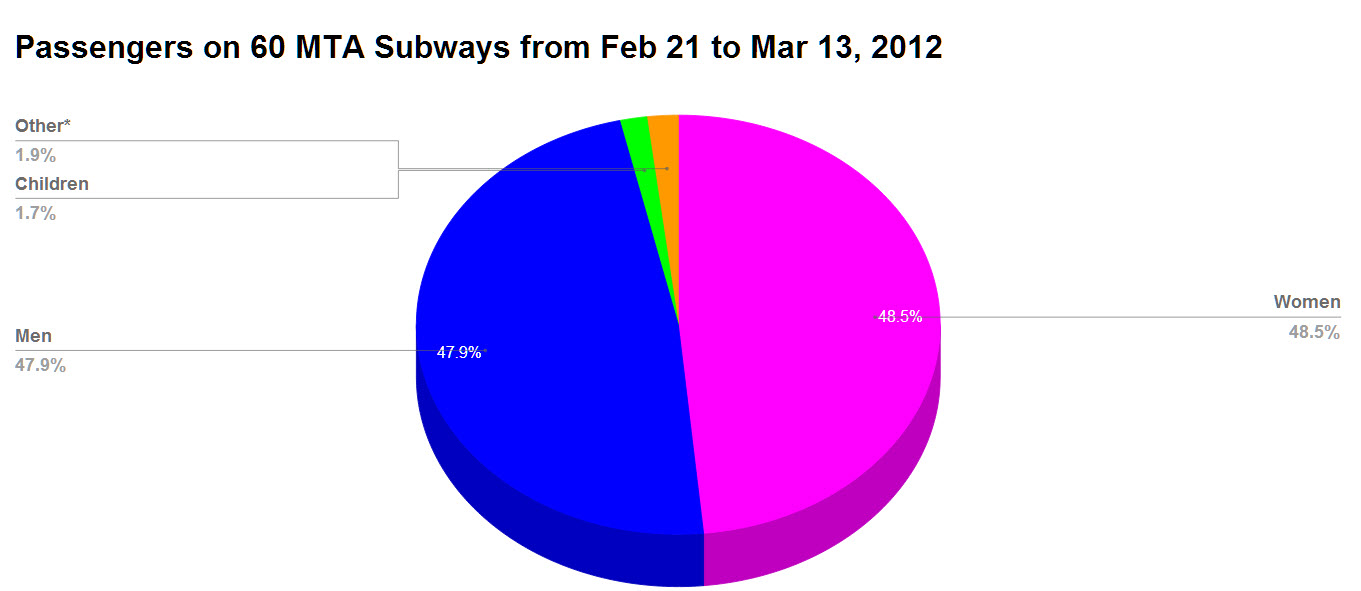
- Of the subway passengers in the study, what percentage consisted of women, men, children, and other? (Here “other” is defined as bulk items that “occupied” a seat, such as large bags, strollers, or a passenger’s leg)
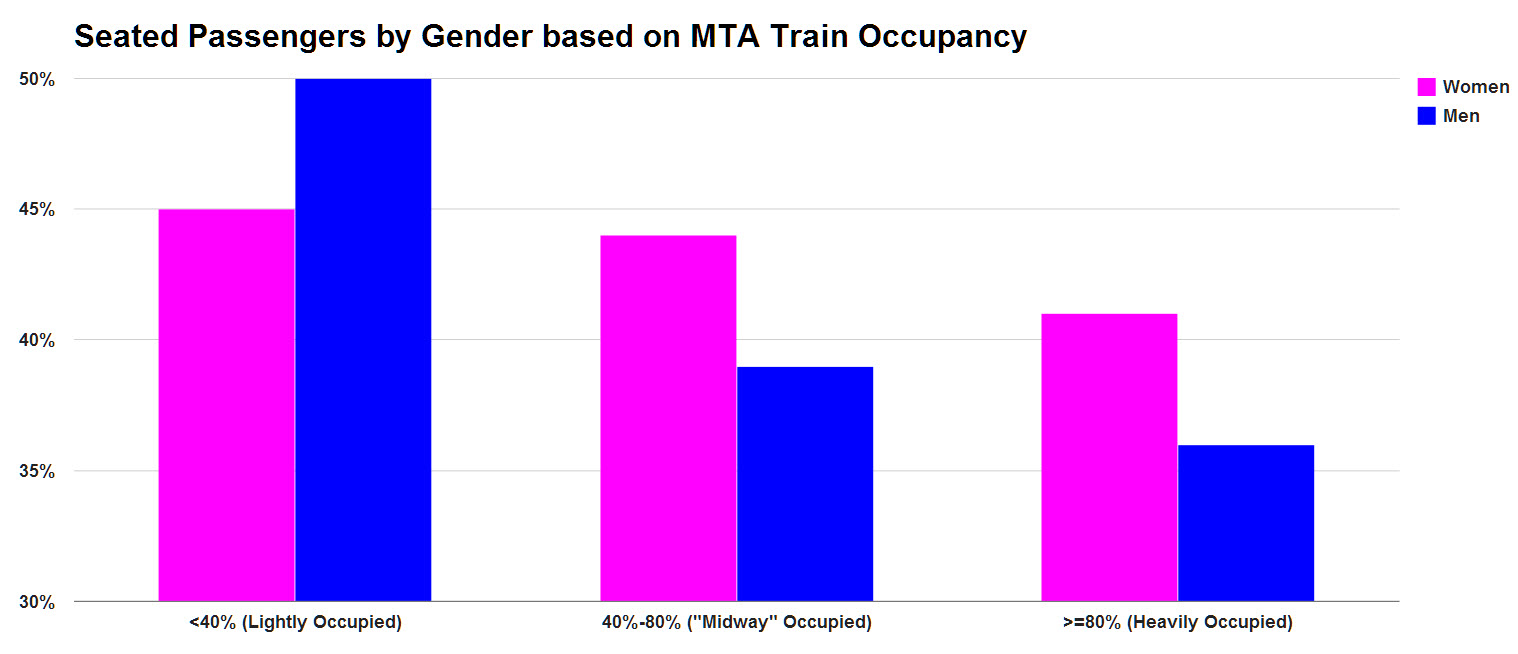
- When a subway is not crowded, do men or women tend to sit more? Does this pattern change when a subway is packed?
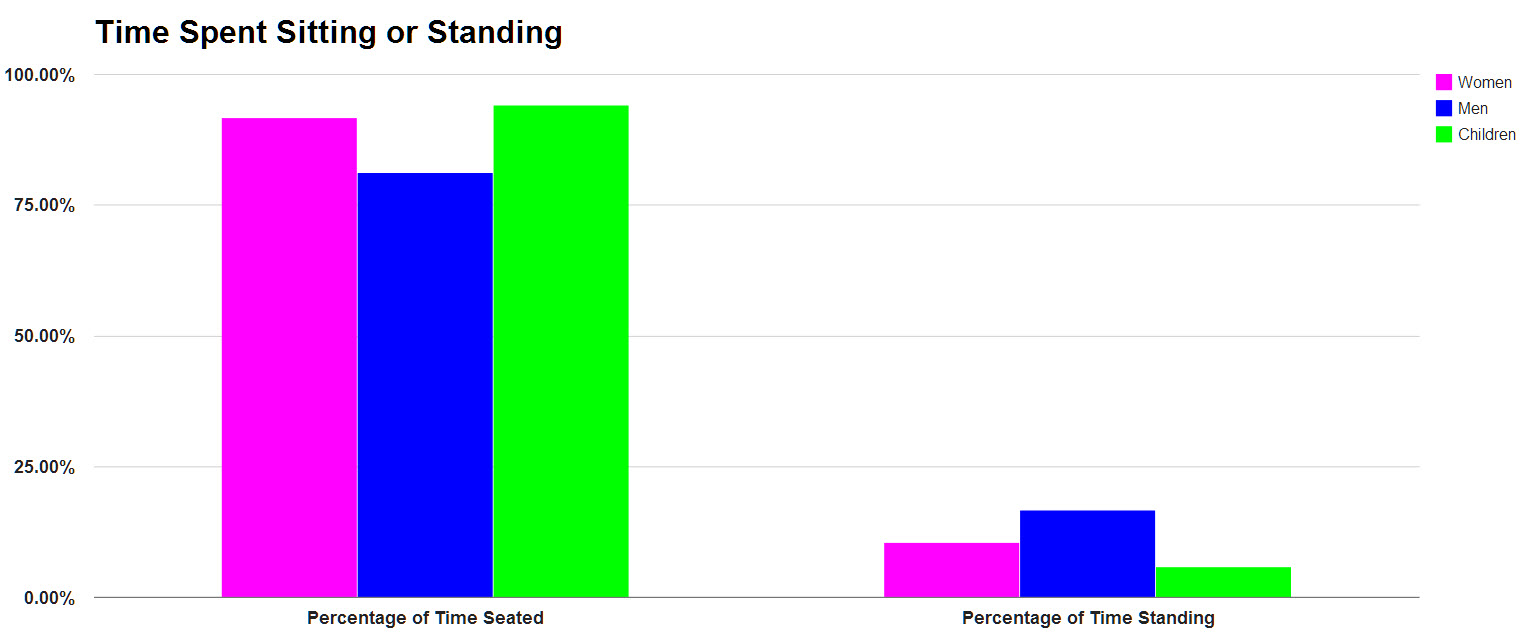
- Overall, what percentage of time do men, women, or children sit or stand on the subway?
How do I create charts in Google spreadsheets? For video tutorials on these charts, click below.
For a copy of our spreadsheet, please email us at spreadsheetsolving@gmail.com or leave a reply below, and we will send it to you!