Fantasy Football Season is here! It’s that time of the year where we sit down on the couch every Sunday to cheer for our group of superstar mercenaries as they help our team embarrass (avoid embarrassment?) those of our friends. Fantasy Football drafts are coming up and this post will hopefully help you with your draft, and of course continue to help you learn how to use spreadsheets.
As we showed in our earlier post on spreadsheet decision making, spreadsheets are a great way to weigh a variety of data and come up with the best possible decision. And any seasoned Fantasy Football player knows that in each of 15 rounds, they face a very complex decision in who to draft (unless you had the first pick last year and took Adrian Peterson)
Spreadsheet goal: Each round, tell us who we should draft in order to maximize our team’s projected points scored.
Spreadsheet inputs:
- Who has been taken already
- How many fantasy points every player is predicted to score
Important caveat for fantasy football experts – this will be a very simple spreadsheet! If you have ideas for more complexity to add, post them in the comments!
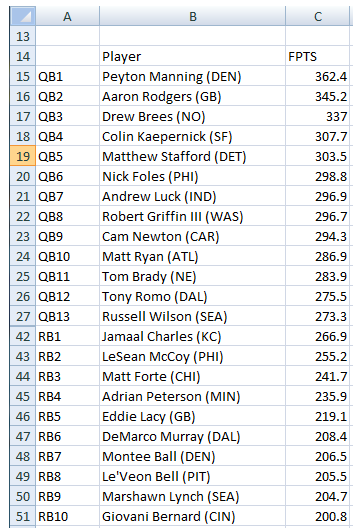
First things first, we need to know how many points each player will likely score. Luckily, there are plenty of sites that do this (likely with the help of many spreadsheets). We are using data from FantasyPros – http://www.fantasypros.com/nfl/projections/qb.php – they take an average of five separate sources. We took the projected Defense points from Yahoo. We put this data into our example spreadsheet in cells B14:C230. We have them in order of projected points scored, and added their position and position rank in column A:
Okay, now comes the hard part…putting in the logic:
In standard fantasy, you are able to play 1 quarterback, 2 running backs, 3 wide receivers, 1 tight end, 1 kicker and 1 defense. Every time you make a draft pick, you’re taking the player who you think will score the most points at that position (let’s say QB), but you also miss out on all the other best players at the other positions (RB, WR, etc), because other managers could draft them before your next pick. By missing out this round, you might wind up taking one of the next best (RB, WR, etc), or you might end up with the one of the leftover (RB, WR, etc) after everyone else has gotten their players at that position – for example the 10th quarterback, or the 20th running back (2RBs x 10 teams) or the 30th wide receiver. This is also known as the “replacement player”.
Our spreadsheet will calculate the difference between the projected points of the best available player at each position minus the average of the next three players at that position, as well as the difference between the best player and the replacement player. This would allow us to select the player that could give us the best chance maximize our team’s point value.
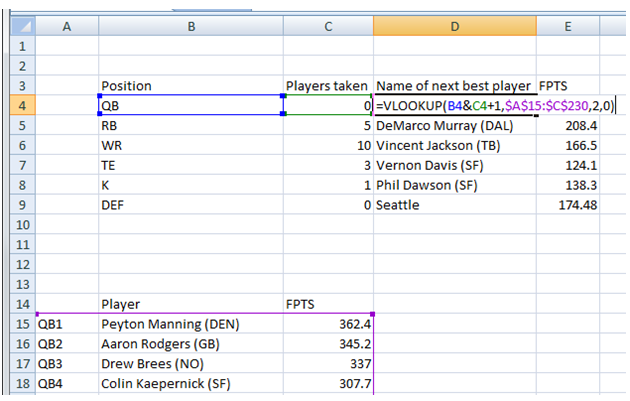
First we create input cells to tell our spreadsheet how many players of each position have already been taken. For simplicity, we assume the other league managers have the same player rankings as we do, and will draft in order…this likely won’t happen, but it is really hard to do otherwise. We can then use vlookup() pull the name of the next best, still-available player at each position (here, 5 RBs have been taken, the next best, “RB6”, is DeMarco Murray):
Next we calculate what the replacement player is projected to score, and then display the difference of the current player versus the replacement. We do a similar vlookup, but we vlookup the rank of the replacement player (10 for QB, 20 for RB, 30 for WR given the number of slots):
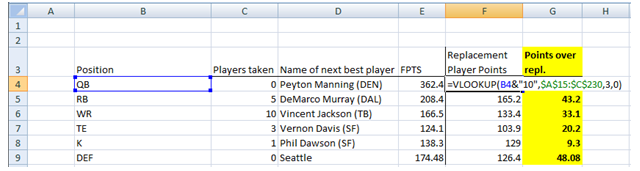
Great! Maybe that old rule about waiting a long time to pick a defense doesn’t apply this year…
Okay, now we take the average of the next three picks to get a sense of what we’d end up with if we didn’t pick the best player at that position this round, but picked a player at that position in the next couple of rounds. Multiple vlookups here and an average function:
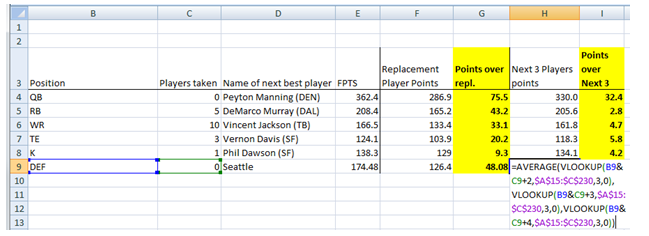
(you probably didn’t need a spreadsheet to tell you that Peyton Manning is really good)
And that’s pretty much it – as the draft progresses, you enter in how many players have been taken at each position, and our spreadsheet will tell you how much better each remaining best player is against the other available players at the position – the replacement player and the average of the next three. Then just pick the player with the highest differences and ride that team into the winner’s circle!
Here is a link to the spreadsheet:
- Google Spreadsheet: Fantasy Football Draft Spreadsheet
- Excel: Fantasy Football Draft Helper
Related posts: