Spreadsheetsolving.com’s compilation of free, customizable, printable math worksheet generator spreadsheets

With summer starting, we thought it would be helpful to put all of our math worksheet generator spreadsheet posts into one (somewhat) organized list. We’ve been creating these spreadsheets over the past three years to help supplement math learning for our own kids.

Note that all of these spreadsheet generators are done in Microsoft Excel. In order to use the free Google Sheets software, you can download and save the .xlsx file onto your computer, go to Google Sheets, and then hit File->Import-> Upload, and select the file. It might need some minor formatting/fitting to print.

Math Worksheets

General Math Worksheet generator – allows parent to set the maximum number size, and what operation, generates a random math worksheet: random math worksheet

Fill in the blank Math Worksheet generator – similar to the prior math worksheet, but instead of figuring out the sum in a standard (addend + addend = sum) problem, one of the three is randomly blank and the student fills in the blank: Math Worksheet generator

Division Math Worksheet generator – the logic and format for a division math worksheet generator was slightly different from the previous: Division Math Worksheet

Addition and Subtraction Math Facts speed spreadsheet – similar to the general purpose spreadsheet but designed to be a speed test of addition and subtraction math facts: Addition and Subtraction Math Facts Speed Worksheet

Number sequence pattern math worksheet generator – here you have a sequence of numbers and can choose spacing, number size, number of blanks for the student to fill out: Number Sequence Pattern Math Worksheet

Math Dice style worksheet – students try use math functions on the randomly generated input numbers to get to the answer number: Math Dice Worksheet

Practice with time math worksheet generator: Time Math Worksheet

Math word problem worksheet generator – this one is a bit crude, but perhaps someone could expand upon it: Math Word Problem Worksheet

Printable Flash Cards

General Purpose Flash Cards with user input and double sided printing: https://spreadsheetsolving.com/create-and-print-physical-flash-cards-with-this-microsoft-excel-template/

Addition and subtraction with math facts under 20 – Here we use our general purpose flash cards spreadsheet and enter in some math facts that students should have memorized: https://spreadsheetsolving.com/printable-math-facts-flash-cards-for-single-digit-addition-and-subtraction-with-carrying/

Multiplication Flash Cards: https://spreadsheetsolving.com/printable-multiplication-flash-cards-spreadsheet/

Division Flash Cards: https://spreadsheetsolving.com/printable-division-facts-flash-cards-spreadsheet/

Printable division facts flash cards spreadsheet

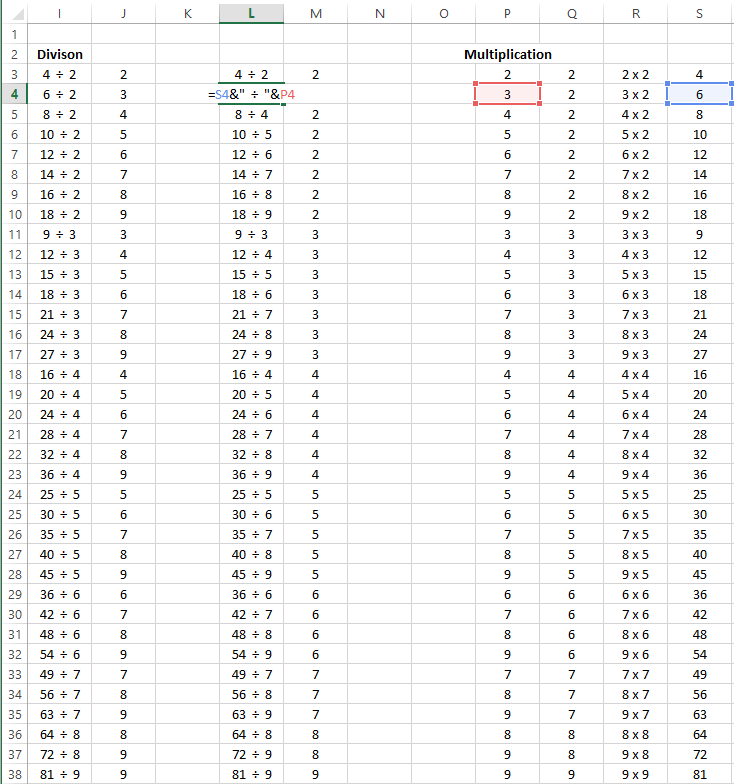
Today’s post is another extension of our series on flash cards. Since we made our multiplication flash cards last, the division flash cards were easy to make by reversing the multiplication answers:

We basically need double the flash cards since 20 divided by 5 and 20 divided by 4 are two different problems, whereas 4×5 and 5×4 are effectively the same.

Download the printable division flash cards spreadsheet here:

Printable Division Math Worksheet Generator Spreadsheet

Today we’ll build a dedicated division spreadsheet, where we set parameters for the problems and print an unlimited number of different division worksheets.

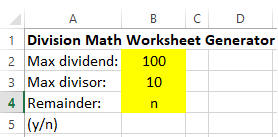
The inputs we’ll allow the user to enter are the maximum dividend (number to be divided) size, the maximum divisor, and whether or not we want to have the answers be able to have remainders.

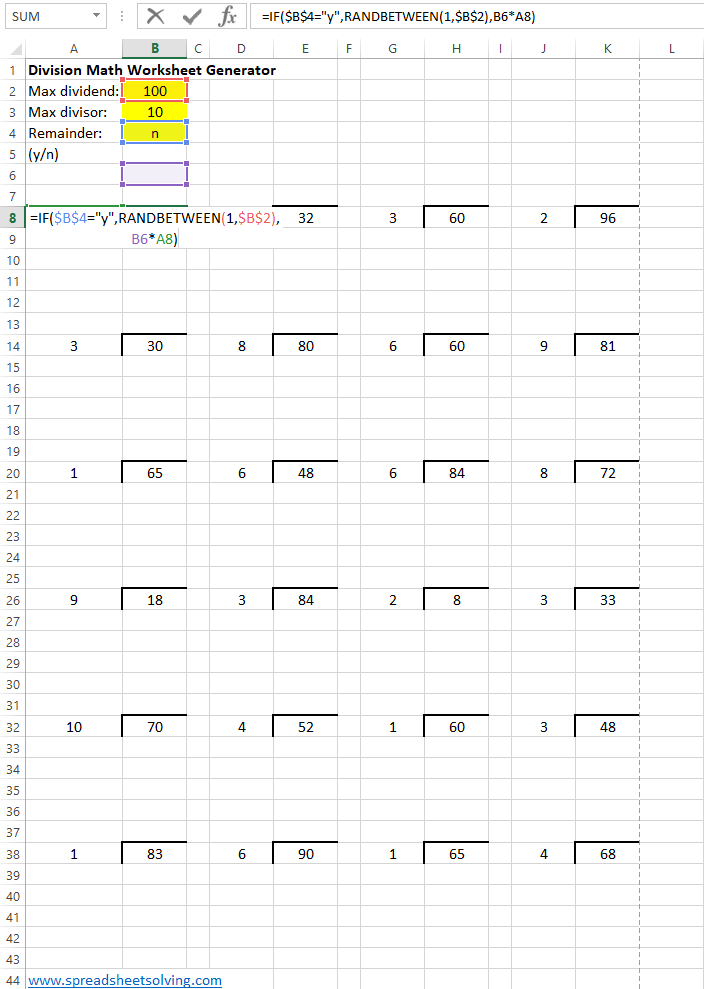
So if the user selects yes or “y” for the remainder, the problem is relatively simple – we’ll have a random number for the answer between (1,100) for the dividend, and then a random number between (1,10) for the divisor.

If the user selects “n”, we’ll have a random number between (1,10) for the divisor, and then a random number between 1 and the max dividend/current divisor for the answer, then we’ll multiply the answer by the divisor to get the dividend.

Here’s how it looks like in full:

You can download the printable Microsoft Excel file here:

Addition and Subtraction Math Facts Speed Worksheet

Today’s post will be another variation of our generic Math Worksheet Generator that we’ve posted before. This worksheet will give students the opportunity to practice their addition and subtraction math facts, so that eventually  things like 9+7 = 16 and 17-9 = 8 will come more quickly.

For the subtraction facts spreadsheet, we made the first number a random number between 11 and 18, and the second number a random number between the first number minus 9 and 9, in order to make the answer a single digit math fact.

For the addition spreadsheet, we made the answer a random number between 11 and 18, and then hid it, then filled in the two addends with one random number and then the answer minus the random number.

Check out the spreadsheet here. We’d also recommend using a stopwatch to help students try to increase speed: Addition and Subtraction Speed Worksheet

Printable Math Facts flash cards for single digit addition and subtraction with carrying

As kids start to add and subtract bigger and bigger numbers, they will have to learn how to “carry” a 10 when adding two numbers that sum higher than 10, and “borrow” a 10 when subtracting a bigger number from a smaller number.

Today’s spreadsheet is an example case of our Printable Flash Cards Spreadsheet, where we put in all the addition and subtraction math facts that students will need to know quickly in order to do longer addition and subtraction problems that may need carrying and borrowing.

Check out the spreadsheet here: Printable Flash Cards

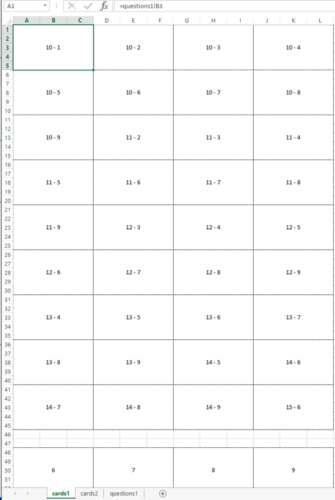
To print – print double sided, and flip on the long edge. There are two tabs (“cards1” and “cards2”) with 72 total flash cards to print. Wish we had some good advice for how to get your kids to actually practice with these…

Build a Math Word Problem Worksheet Generator

Whether you love or hate the Common Core, to be successful at the test one needs to able to solve math word problems. Today’s spreadsheet will allow you to practice by generating a unique set of math word problems each time it is refreshed. Special thanks to my coworker V for the idea (or alternatively, you know who to blame).

Spreadsheet Inputs

The goal for today’s spreadsheet is to generate five word problems with randomized inputs for the numbers. Word problems tend to follow similar patterns, and we’ll try to replicate some common word problems. There are many different types of word problems (this set of 120 of them from Prodigy is a good example), but maybe we’ll stick to some simple addition and subtraction problems for now.

We’ll make our own simple problems where (some person) has (some number) of an object and either gets (some number) more or less, and then add some small variations.

For the person, we’ll randomly pick one of the top 50 girls and boys names from the year 2019. We’ll also randomly pick the object. This will go on a separate tab to keep things clean:

Our main user input will be how large they want the numbers to add or subtract to be, essentially adjusting for the difficulty:

Then we’ll go back to the second page to create some word problem templates. We’ll generate a random number between 1-100 for the name, identify the gender, take a random object between with a random number between 1-26, then generate enough random numbers for each type of problem.

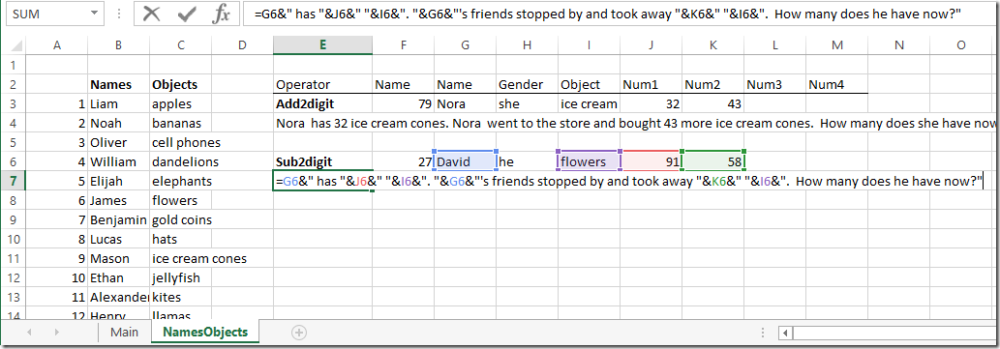
Here we made formulas to generate word problems for 2 number addition and subtraction:

The next steps were a little involved, and required formatting, merging and centering cells. To use the sheet, one would need to paste in the desired templates for each of the 5 questions. One could also create new templates to paste in:

Check out the spreadsheet here: Math Word Problem Generator

If you like today’s post, check out the other customizable kids educational spreadsheets that we’ve created during this pandemic:

Build a Net Worth Estimator Spreadsheet

We’ve just hit week 4 of coronavirus-related working-from-home. Hope everyone is staying safe and staying home if you are able. One thing I’m starting to miss is workplace banter – conversations about TV shows, sports, and celebrity net worths. This post was also inspired by a blog post from Root of Good detailing their net worth progression between 2004 and 2014. In any case, it seems the fascination/financial voyeurism of guessing people’s net worth is widespread, and we’ve built a spreadsheet for the job.

Spreadsheet Inputs

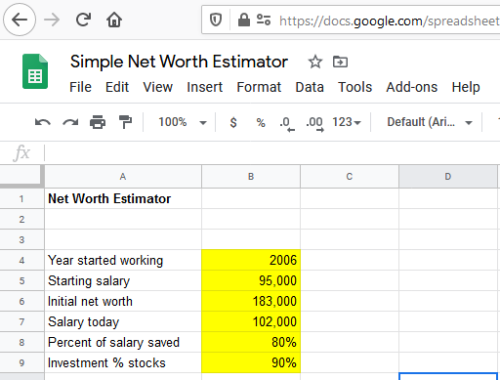
So, here we have another “essence of modeling” problem. We could make our spreadsheet hopelessly complicated and precise with detailed inputs for tax rates, investment allocation, debt, and spending, etc. I’m making the choice to make the spreadsheet be as simple as possible. Our 6 inputs will be:

  • The year you started working and your starting income. (Or check glassdoor.com to estimate someone else’s).
  • Your initial net worth – some people have a head start
  • Your income now – I’m going to assume that you’ve worked every year and your income has gone up (hopefully) in a straight line fashion to today.
  • The percentage of your gross salary you saved each year. The Root of Good appears to have saved around 70-80% of their income. It appears the national average is closer to 8%.
  • How aggressively you invested your savings (%stocks vs %cash). I’ve input the annual returns from stocks using this helpful data from slickcharts

We’ll go with Google Sheets for today’s spreadsheet, and just for fun, let’s try to replicate the Root of Good’s numbers:

Spreadsheet calculations and output

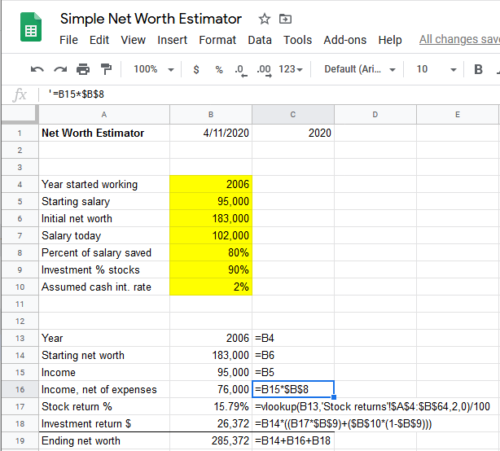
In our spreadsheet, we begin with our inputs for the first year. Each year we take the starting net worth, add the income net of expenses to it. We then look up what stocks returned that year and calculate the investment return from their beginning net worth. We add it all together to get the ending net worth for the year:

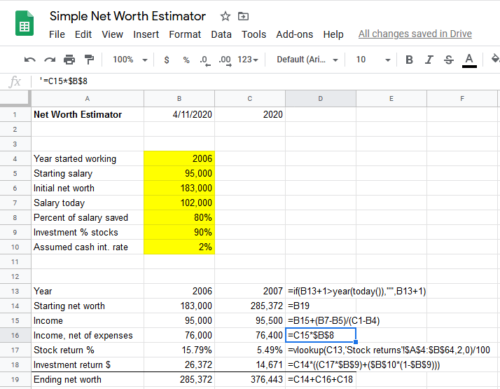
For each future year, we’ll increase the year by one (until we get to the current year), increase income in a straight line between their current and final income, and add the relevant investment return:

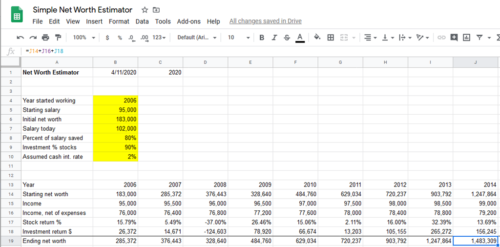
Then we can paste in the formulas from column C into the right columns:

Our spreadsheet would have predicted Root of Good’s net worth in 2014 was $1.48 million. Their post indicated it was $1.35 million. Pretty close for just the few inputs that we used!

Check out the link to our net worth estimator spreadsheet here to play with it yourself. Remember, you can save a copy to your own Google Drive by going to File –> Make a Copy.

It would be a fun exercise if you (anonymously) posted in the comments what the spreadsheet calculated for you versus your actual net worth. That data would be tailor-made for an xy-scatter plot.

Marriage Tax Penalty Spreadsheet Update – Republicans improve the economics of getting married!

We’ve updated our original Marriage Tax Penalty Spreadsheet using the new brackets from the Republican Tax Plan. Having done the original in a spreadsheet, all we had to do was copy the whole sheet over, and then adjust the numbers in columns A to C according to the new tax brackets, and update the data table. Easiest post ever!

Somewhat surprisingly, the new Republican tax brackets are quite beneficial for higher income married working couples, as it mostly eliminates the marriage tax penalty for those earning less than $600k combined (previously they kicked in when both people were making around $75-100k). The married brackets now are just generally double the individual brackets, except for a kink around the $500k-600k range. Continue reading “Marriage Tax Penalty Spreadsheet Update – Republicans improve the economics of getting married!”

Classroom Seating Layout Spreadsheet

What seating arrangement is best for your classroom? Traditional rows and columns? U-shaped? Clusters?  Do you want your students seated alphabetically or randomly? Use this spreadsheet to plan and experiment with various seating layout options for your classroom! Continue reading “Classroom Seating Layout Spreadsheet”

Check the “Rule of 72” with a spreadsheet

One of the more amazing things I’ve encountered while studying finance is the Rule of 72. This rule effectively tells you how long it would take to double your money, depending on what interest rate you are earning on it. So if you were earning 4% a year, it would take roughly (72/4) = 18 years to turn $1,000 into $2,000.

But does it really work? Let’s verify with a spreadsheet! Continue reading “Check the “Rule of 72” with a spreadsheet”

Build a Secret Santa Spreadsheet

Christmas is here again, and while we at SpreadsheetSolving appreciate the festive spirit, our practical side always wonders “does every single friend need a gift from each of their other friends?”. And… “why can’t we just give cash?”

The game Secret Santa somewhat lessens this gift giving burden among a large group of people. In this game, each person is secretly assigned one other person in the group to give a gift to. Typically, when the person opens their gift, they try to guess who gave it to them. Great fun is had by all (in theory).

We can create a simple spreadsheet to set up the random assignment of people to others in a group. First we enter in a hypothetical list of names: Continue reading “Build a Secret Santa Spreadsheet”

Will you pay more or less under the Trump Tax Plan?

After nearly a year and a half after the candidates first declared their intention to run for the Presidency, we have now elected a new President. Trump’s Presidency was a surprise to many, and with Republicans in control of both the House and Senate along with the Presidency, major changes could be possible.

One of those changes could be taxes, where Trump has proposed a tax system with three tax brackets of 12%, 25% and 33% and an increase in the standard deduction to $30k for joint filers, while also eliminating exemptions for dependents. We wondered: roughly how would taxes change for any given level of income, filling status, and number of family members? This is a problem spreadsheets are well suited to solve! Continue reading “Will you pay more or less under the Trump Tax Plan?”