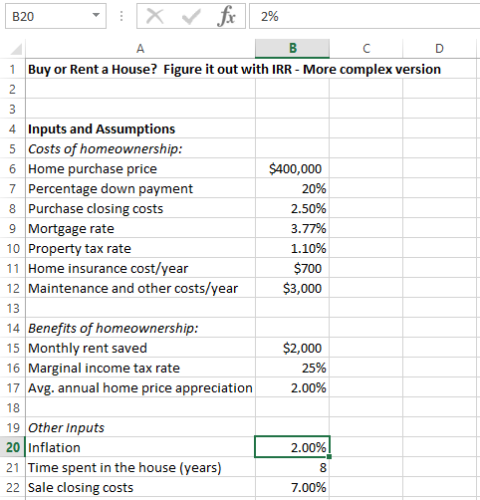
An application of our IRR based Buy vs Rent spreadsheet
Based on a casual look at the economy, things are going pretty well – unemployment is down and GDP growth is strong. So it would seem to make sense that U.S. home prices are up about 3.5% so far this year, right?
But if we rewind the clock by a year, many of the economic factors involved in owning a home in the U.S. have gone the wrong way:
- Mortgage rates are up to 4.41%, from 3.77% exactly one year ago for 30Y fixed.
- Mortgage interest is only deductible up to $750k in principal, down from $1 million one year ago.
- Federal marginal tax brackets are slightly lower (making the value of the mortgage interest deduction smaller)
- State and local taxes (including property taxes) are now only deductible up to $10,000. (although this is complicated by the possibility you were paying AMT last year and weren’t able to fully deduct state and local taxes anyways…)
Let’s use a spreadsheet to compare the values of three hypothetical houses in California – today versus from one year ago – based on changes in mortgage rates, marginal tax rates, and mortgage interest deductibility requirements.
Spreadsheet Inputs
We already built our IRR based Buy vs Rent spreadsheet in this post. A refresher: this spreadsheet calculates the internal rate of return from all the cash flows involved in owning real estate. Here we’ll calculate the IRR for three hypothetical houses (based on current average price to rent ratios), and compare the before and after value from one year ago:
1. Modesto example – A $400k house, rents for $2000/month, income of $115k (we’ll assume a 3.5x price to income ratio, this will just be for the tax rate change).
2. Los Angeles example – A $900k house, rents for $4000/month, income $257k.
3. San Francisco example – A $1.6 million dollar house, rents for $5000/month, income of $457k.
Spreadsheet Outputs
For each of our three areas, we will plug in the house price and rent saved, using other assumptions from last year, including the mortgage rate, marginal tax rate, and the deductibility of the mortgage. We’ll take note of the IRR, and then plug in this year’s numbers and use the Goalseek function to figure out what the home price should be to maintain the same IRR. Note that we won’t touch the property tax deduction, and that we edited our old sheet to add some maximum mortgage tax deduction logic.
Instead of walking step-by-step through the analysis, here is a summary table of our findings. I’m a little shocked that San Francisco housing should have been about 11% worse after the tax changes. I guess when housing is rising by over a grand a day, the effects of the tax law changes get drowned out?
Check out the spreadsheet here: CA home buy vs rent irr application


