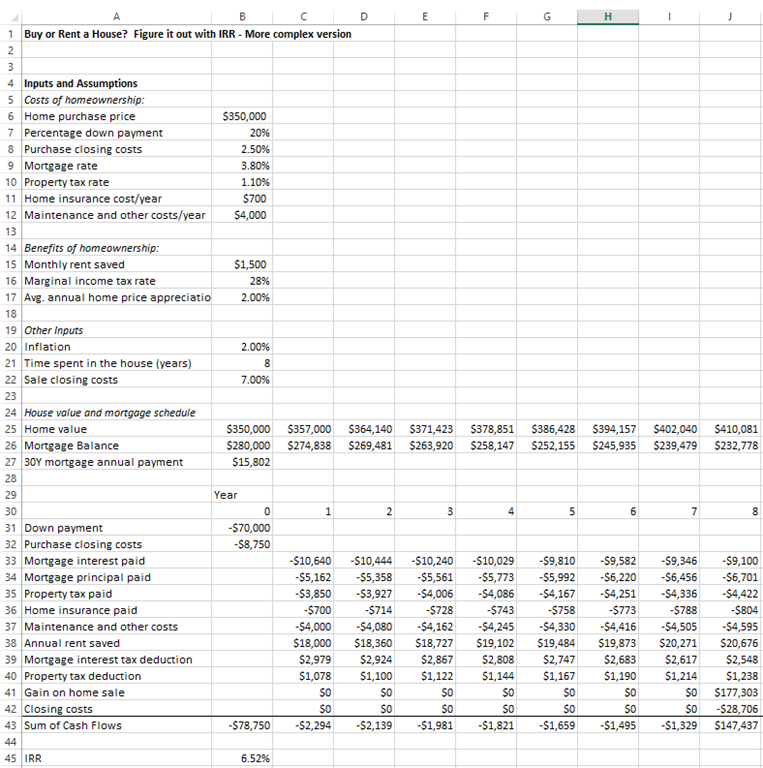
This post will be a quick update to our original buy vs. rent spreadsheet post, given changes in the economics of housing due to the Tax Cuts and Jobs Act from late 2017. First, a quick review of how the original sheet worked: we had taken the main costs and benefits of home ownership as inputs and calculated what IRR you effectively were earning on your down payment:
Major changes to the spreadsheet include:
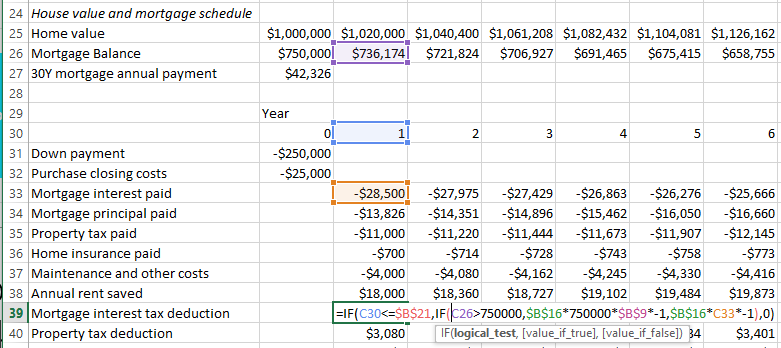
1. Mortgage interest is now only deductible for the first $750k. We adjust the formula for the tax benefit of the mortgage interest deduction to include an if statement that checks if the mortgage balance is above $750k. If so, the tax benefit is limited to deducting interest on the $750k.
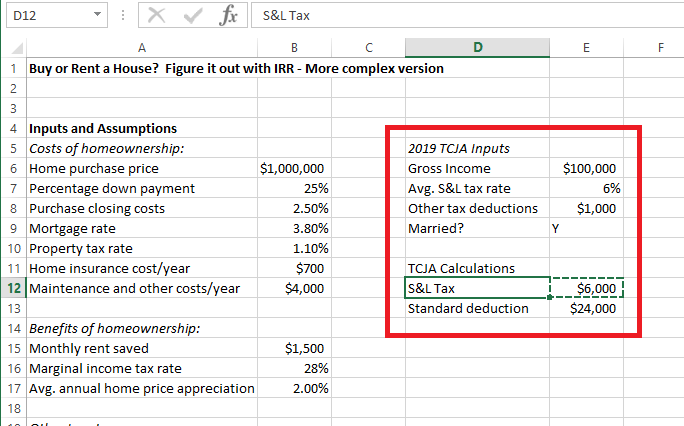
2. The value of the property tax deduction is likely lower due to the cap on state, local, and property tax deductions at $10k.
3. The standard deduction is much higher: $24k for a married couple for 2019 versus $12,700 in 2017. This makes it more likely people end up just taking the standard deduction, which means the property tax deduction is not used, or could make the part of the mortgage interest that is under the $24k cap not useful.
We’ll work on both of these problems together, with some simplifying assumptions. First, we’ll ask users to input their income, average tax rate, and other federal tax deduction items (charitable giving, etc), and whether they are married. This will give a sense of whether they were already at the $10k SALT cap, and therefore implies the property tax deduction wouldn’t be worth anything to them. Also, only the portion of the mortgage interest that puts the user above the standard deduction is worth anything, so we add that logic in as well:
(36 hours later…)
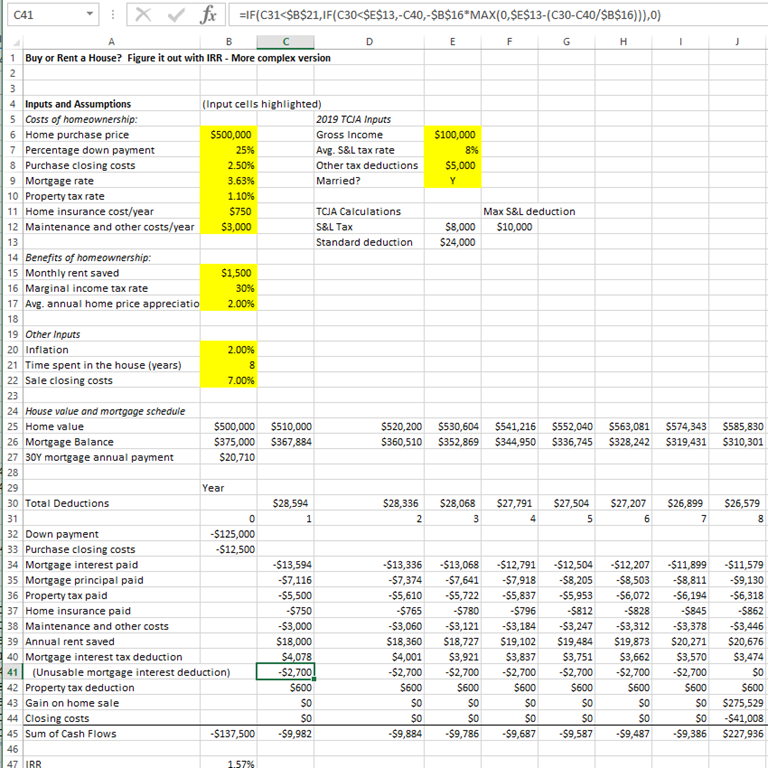
Okay, we kept running into complicating factors, and the formulas we’re now using for the mortgage and property tax deductions have gotten very convoluted (check out the formula below that calculates what portion of the mortgage interest deduction is not really a marginal benefit because it was needed to put you over the standard deduction). Here’s what we have, rather than try to explain it step by step, try walking through it yourself, or if you have a better solution, let us know!
Check out the spreadsheet here: home buy vs rent complex 2019 update
