After nearly a year and a half after the candidates first declared their intention to run for the Presidency, we have now elected a new President. Trump’s Presidency was a surprise to many, and with Republicans in control of both the House and Senate along with the Presidency, major changes could be possible.
One of those changes could be taxes, where Trump has proposed a tax system with three tax brackets of 12%, 25% and 33% and an increase in the standard deduction to $30k for joint filers, while also eliminating exemptions for dependents. We wondered: roughly how would taxes change for any given level of income, filling status, and number of family members? This is a problem spreadsheets are well suited to solve!
Spreadsheet Inputs
- Current tax brackets and Trump’s proposed tax brackets. Some detailed-oriented readers will say there are many elements to the tax plan (like deduction caps, repeal of AMT, etc.); but for simplicity’s sake, we will concentrate on the effects of the tax brackets, the increase in the standard deduction, and the elimination of personal exemptions:
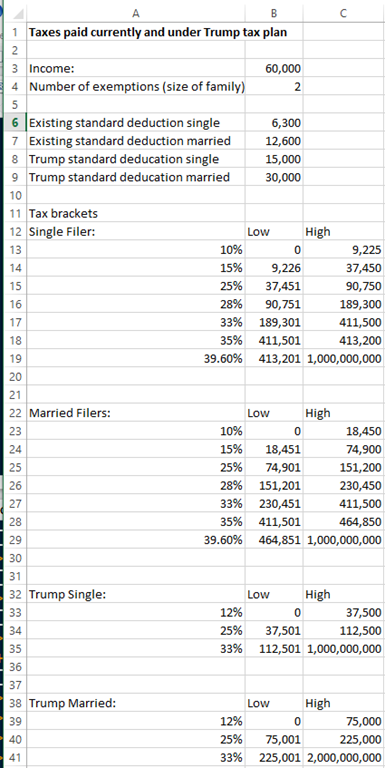
Current Tax Brackets
Proposed Tax Brackets under the Trump Plan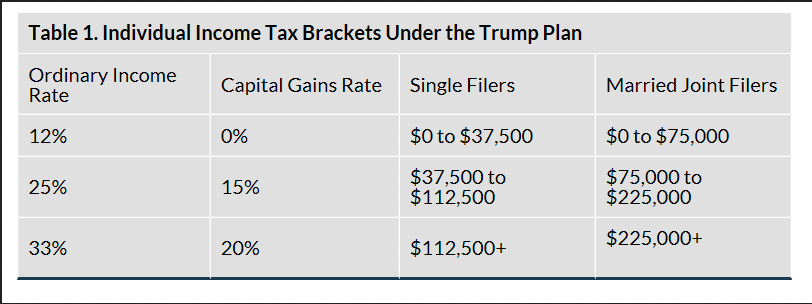
- The amount of income we want to calculate taxes owed for.
- Family size (for example, a married couple with one kid is 3)
Here’s what our spreadsheet looks like so far:
Spreadsheet Logic
We use the same logic we used to calculate taxes owed in our previous two tax posts (yes, we now have three posts on taxes, we are masochists): Calculate the marriage tax penalty and How to Estimate Taxes with Spreadsheets. First we calculate adjusted income by taking out the standard deduction and exemptions for the existing tax brackets. Then for each appropriate line within a filing status, we use an if() statement to see if the income is above, below, or in between the brackets, then make the appropriate calculation.
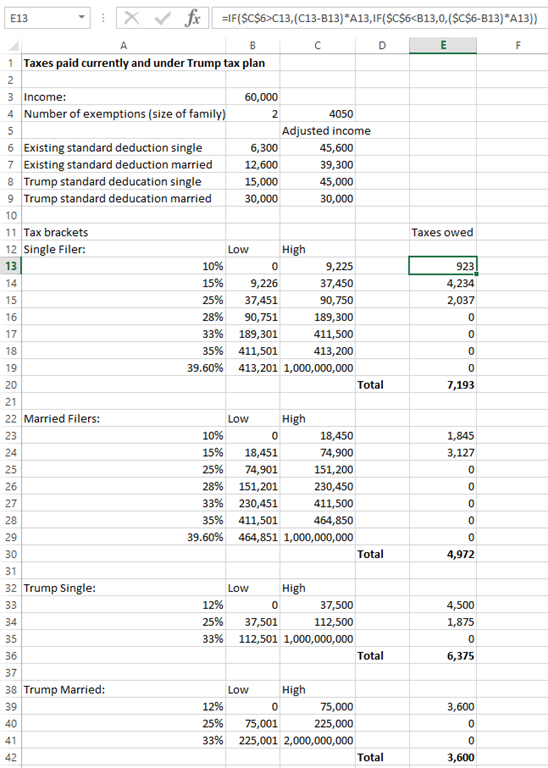
That’s pretty much it for the calculation. For this example, the savings under the Trump plan of a $60k salary would be around $800 ($7193 vs. $6375) for a single filer with a child and $1400 ($4972 vs. $3600) for a married filer with no children.
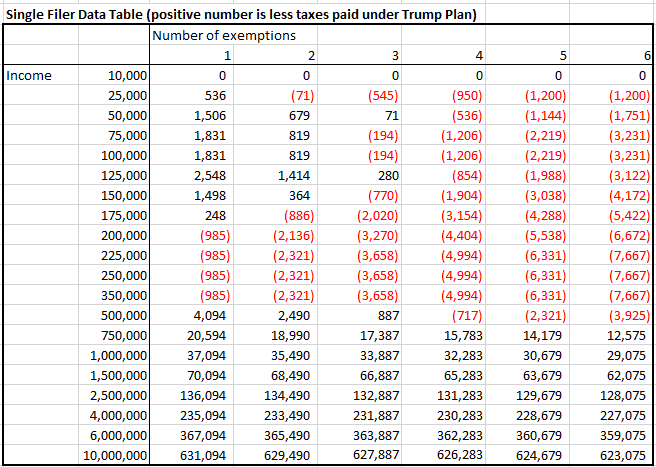
One nice feature of spreadsheets is once you set up the logic, you can tell Excel to display the spreadsheet output (tax savings under the Trump tax plan) for a variety of inputs (income and number of exemptions) and see how the Trump tax plan might affect many different people all at once. We’ll spare the gory details and just paste our output. Please check out the spreadsheet to see how we did it.
As seen below, it looks like if you’re single and either making between $200k to $350k, or making less than $350k and with 2 or more kids, you might be one of the few people paying more. This might be offset by some of the plans for new childcare credits.
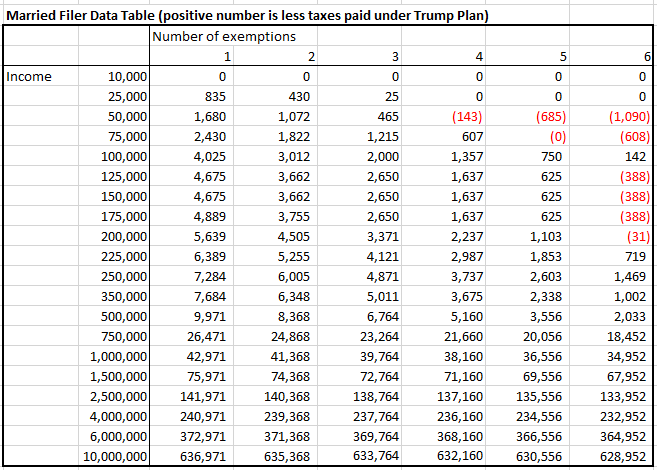
Generally, it looks like married couples will be paying less than before, as the tables below show.
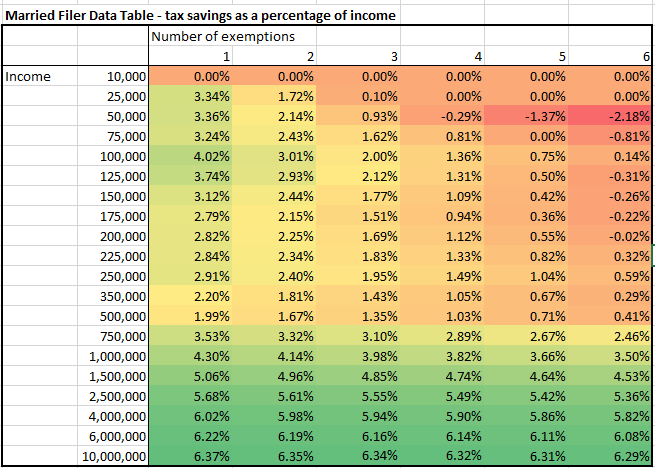
Finally, we took the previous table for married couples and calculated the percent of income saved and applied conditional formatting. Based on a quick glance below, the percentage of income saved goes up with income.
For the spreadsheet, please see here: Will you pay more or less taxes under the Trump Tax Plan?
I love the idea and especially the comparative math. However, when I downloaded the spreadsheet, the income tax rates did not reflect the values you show on the page above. Your page above shows the proposed 12% rate, but the downloaded sheet shows a 10% rate, making a substantial change in the number of winners and losers in the +/- sides. Also, I played with it a little and added in some itemized deduction math that was interesting and made the wealthier filers even more favored based on this site’s averages: https://fas.org/sgp/crs/misc/R43012.pdf
Great work on this.