
How does my life compare to the average American’s? What does my ideal day look like? With data from the Bureau of Labor Statistics (BLS), Google spreadsheets, and problem-solving skills, let’s conduct some analysis with Tree Maps.
How does my life compare to the average American’s? What does my ideal day look like? With data from the Bureau of Labor Statistics (BLS), Google spreadsheets, and problem-solving skills, let’s conduct some analysis with Tree Maps.
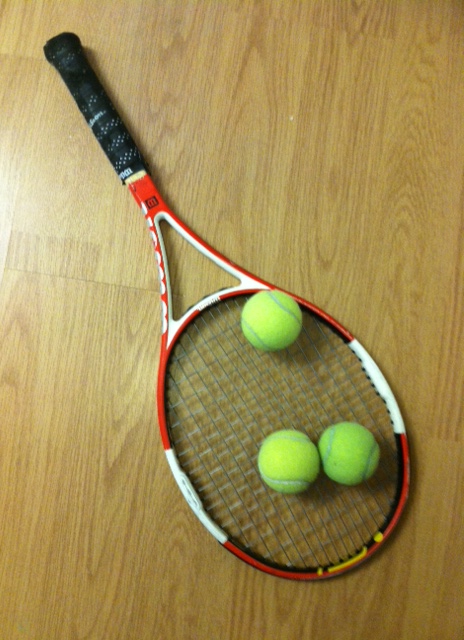
We feel inspired after watching amazing tennis matches, especially from the Grand Slam tournaments: Australian Open, French Open, Wimbledon, and US Open. After witnessing these matches, we feel the desire to get out on the court and play. How can we organize a tennis tournament to engage in some fun match-play? Let’s discover how to schedule a round robin tennis tournament and score card using spreadsheets!![]() Continue reading “How to Schedule a Tennis Tournament”
Continue reading “How to Schedule a Tennis Tournament”

What do sunflowers, shells, honeybees, the Parthenon, and human arm length measurements have in common? All reflect a remarkable pattern of numbers. Now just where does this intriguing sequence of numbers come about? Let’s discover the Fibonacci sequence and the Golden Ratio and how we can use spreadsheets to calculate them! Continue reading “Fibonacci and the Golden Ratio in Spreadsheets”

Charts are everywhere – books, newspaper articles, magazines, ads, and even TV shows [Click here for a video clip of How I Met Your Mother]. Valuable, practical, and fun, charts enable us to visualize and understand data. In 3 steps, you can build any chart in Google spreadsheets. Continue reading “How to Create Charts in Google Spreadsheets”
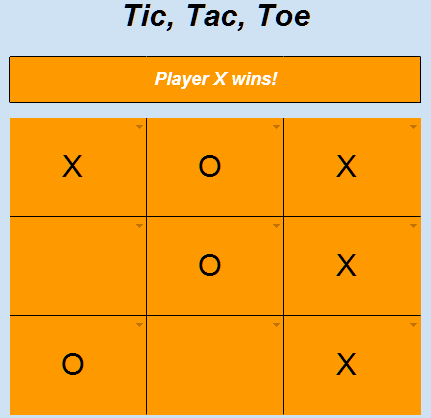
Did you know you can create an interactive online Tic Tac Toe game in 5 steps? Google spreadsheets makes this possible! Two beautiful features of a Google spreadsheet are 1) it is online-based, so anyone with an Internet connection can play; and 2) Google spreadsheets are free! To access it, view our post: spreadsheetsolving.com/access Continue reading “How to Create an Online Game in 5 steps”

Nutella has recently been a prime target of thefts – from the undergraduate dining halls of Columbia University to a central German town of Bad Hersfeld, where 5 tons of this hazelnut spread was discovered from a parked trailer. Imagine a trailer holding 7,150,000 calories, 780,000 grams of fat, and over 1.5 tons of sugars – all packed in this delicious spread! Continue reading “Nutella “Spread”sheet Analysis”

How do we make use of an explosion of information? What skills do we need to manage massive amounts of data? Can we analyze them, create visualizations, and make discoveries?
If any of these questions intrigue you, you may be interested in “the sexiest job in the 21st century” (according to the Harvard Business Review).
Released today, Googex* is the world’s first spreadsheet that can sing. In the menu ribbon, a musical note icon invites you the press it. The moment you do, Googex bolts out with a song that can range from pop to opera to the blues. Try it out here: Continue reading “The Spreadsheet that Sings”
“‘Most teams are using spreadsheets or just using our reports,’ says Brian Kopp, executive vice-president at STATS. ‘The Raptors go a step beyond that, which only a few teams are doing, and their visualizations are the best I’ve seen.'”
This quote is taken from a piece describing how technology, statistics, and analytics are changing basketball.
Full article here.