How to Analyze Stocks in Spreadsheets

In a few steps, you can create a basic stock analyzer spreadsheet. Our post and 5-minute video tutorial will guide you to building a spreadsheet template that charts prices, calculates return and volatility metrics, and identifies lowest and highest daily returns! (Basic template also accessible below).

[youtube=http://youtu.be/hMawNIfdFRo]

Continue reading “How to Analyze Stocks in Spreadsheets”

How to Track & Analyze Spending

Where does your money go? This is an important question, because it gets to the heart of basic money management and personal finance. Let’s discover and create a spreadsheet application that tracks and analyzes your spending!  Continue reading “How to Track & Analyze Spending”

How to Visualize Data

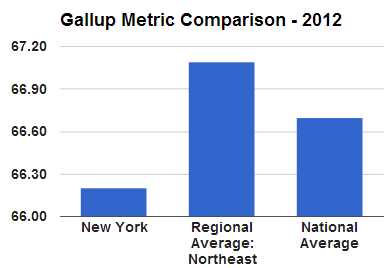
Is the typical New Yorkers’ overall “well-being” better than that of the national average? Nope! How did we quickly conclude this? Check out the graph to the right. Data visualization is an effective (and fun) way to understand information!

Too much information can be overwhelming. But there are ways to channel the desired data and convey it in a way that makes it quick and easy to understand. Let’s discover the power of data visualization by creating a flexible, automatic tool shown below. To see this tool live in action, see our 2-minute video below:

Continue reading “How to Visualize Data”

Pampered Pooches: Is Pet Spending Recession-Proof?

sushi
Sushi (Photo: May Ko)

When asked which child she adores most, my mom would remark without hesitation, “Sushi is my favorite.” Sushi is an adorable 7-year-old schnauzer. As many may relate, pets are a part of the family, with a few lucky ones elevated to “favorite child” status. Continue reading “Pampered Pooches: Is Pet Spending Recession-Proof?”

How to Estimate Taxes with Spreadsheets

© Photographer John Hix | Agency: Dreamstime.com

The tax code is complex: figuring out just how much we owe Uncle Sam is frequently accompanied with a huge headache. So just how neat would it be if we had an easy way to estimate how much federal taxes we owe?

By the end of this post, you will 1) understand how our federal tax schedule works, and 2) be on your way to creating a tax estimator spreadsheet. Continue reading “How to Estimate Taxes with Spreadsheets”

Mad Men Salary Equivalence

© Photographer Dana Rothstein | Agency: Dreamstime.com

In Season 5 of Mad Men, a TV series set in the 1960’s, Peggy leaves the company to accept a salary of $19,000.   What does $19K in 1967 equate to in today’s dollars?   Let’s solve it with a spreadsheet!

Continue reading “Mad Men Salary Equivalence”

Employment Patterns by Gender since 1948

In honor of Women’s History Month in March, check out our poll below:  what percentage of the work force consisted of women in 1948?  Keep in mind that just 28 years prior to 1948, women were first granted the right to vote.   How have employment patterns by gender changed over time?  Let’s use our spreadsheet problem solving skills to figure this out!

[polldaddy poll=6991261]

Continue reading “Employment Patterns by Gender since 1948”