Predicting a Tennis Pro’s Weight based on Height

TechsmithWorEE2E.pngWith a Grand Slam approaching, let’s talk tennis! If we were to predict a tennis pro’s weight based on his height, where would we begin? How will our understanding of the best-fit line and spreadsheets help us make this prediction?

We’ve collected the heights and weights of tennis pros including Federer, Djokovic, Nadal, Murray, Azarenka, Sharapova, and Williams, along with another 192 top players. Let’s investigate how to 1) calculate the correlation of weights and heights, and 2) draw a best fit-line and scatter plot in Google spreadsheets to extrapolate or make predictions!

Continue reading “Predicting a Tennis Pro’s Weight based on Height”

Calculate Distance Traveled with Spreadsheets

mini
Photo: Katie Ko

If you have data such as velocity and time traveled, would you be able to calculate the total distance journeyed? Let’s discover how to tackle this question with spreadsheets! We’ll first begin by calculating distance traveled when velocity is constant. Then we’ll approach a more realistic situation of varying velocity using the Mid Rectangular Approximation Method (MRAM)! Continue reading “Calculate Distance Traveled with Spreadsheets”

Take the ‘Order of Operations’ Spreadsheet Quiz!

TechsmithWor63E8.pngKnow the rules of the order of operations? A central concept in pre-algebra/algebra, these rules clarify which actions in any algebraic expression should be performed first. Let’s review what the rules are and why they are important. Then, you can test your knowledge with a spreadsheet quiz!   Continue reading “Take the ‘Order of Operations’ Spreadsheet Quiz!”

How Accurate is your Robot? Measurement Error & Spreadsheets

No robot or machinery is consistently perfect. Glitches might occur with overuse, or the environment is unsuitable. While achieving a perfectly functioning robot is a noteworthy goal, it may not be realistic. So, what level of error or tolerance level would you be willing to accept? Let’s discover how to use spreadsheets as a tool for understanding and calculating measurement error. Continue reading “How Accurate is your Robot? Measurement Error & Spreadsheets”

Probabilities & Dice Roll Simulations in Spreadsheets

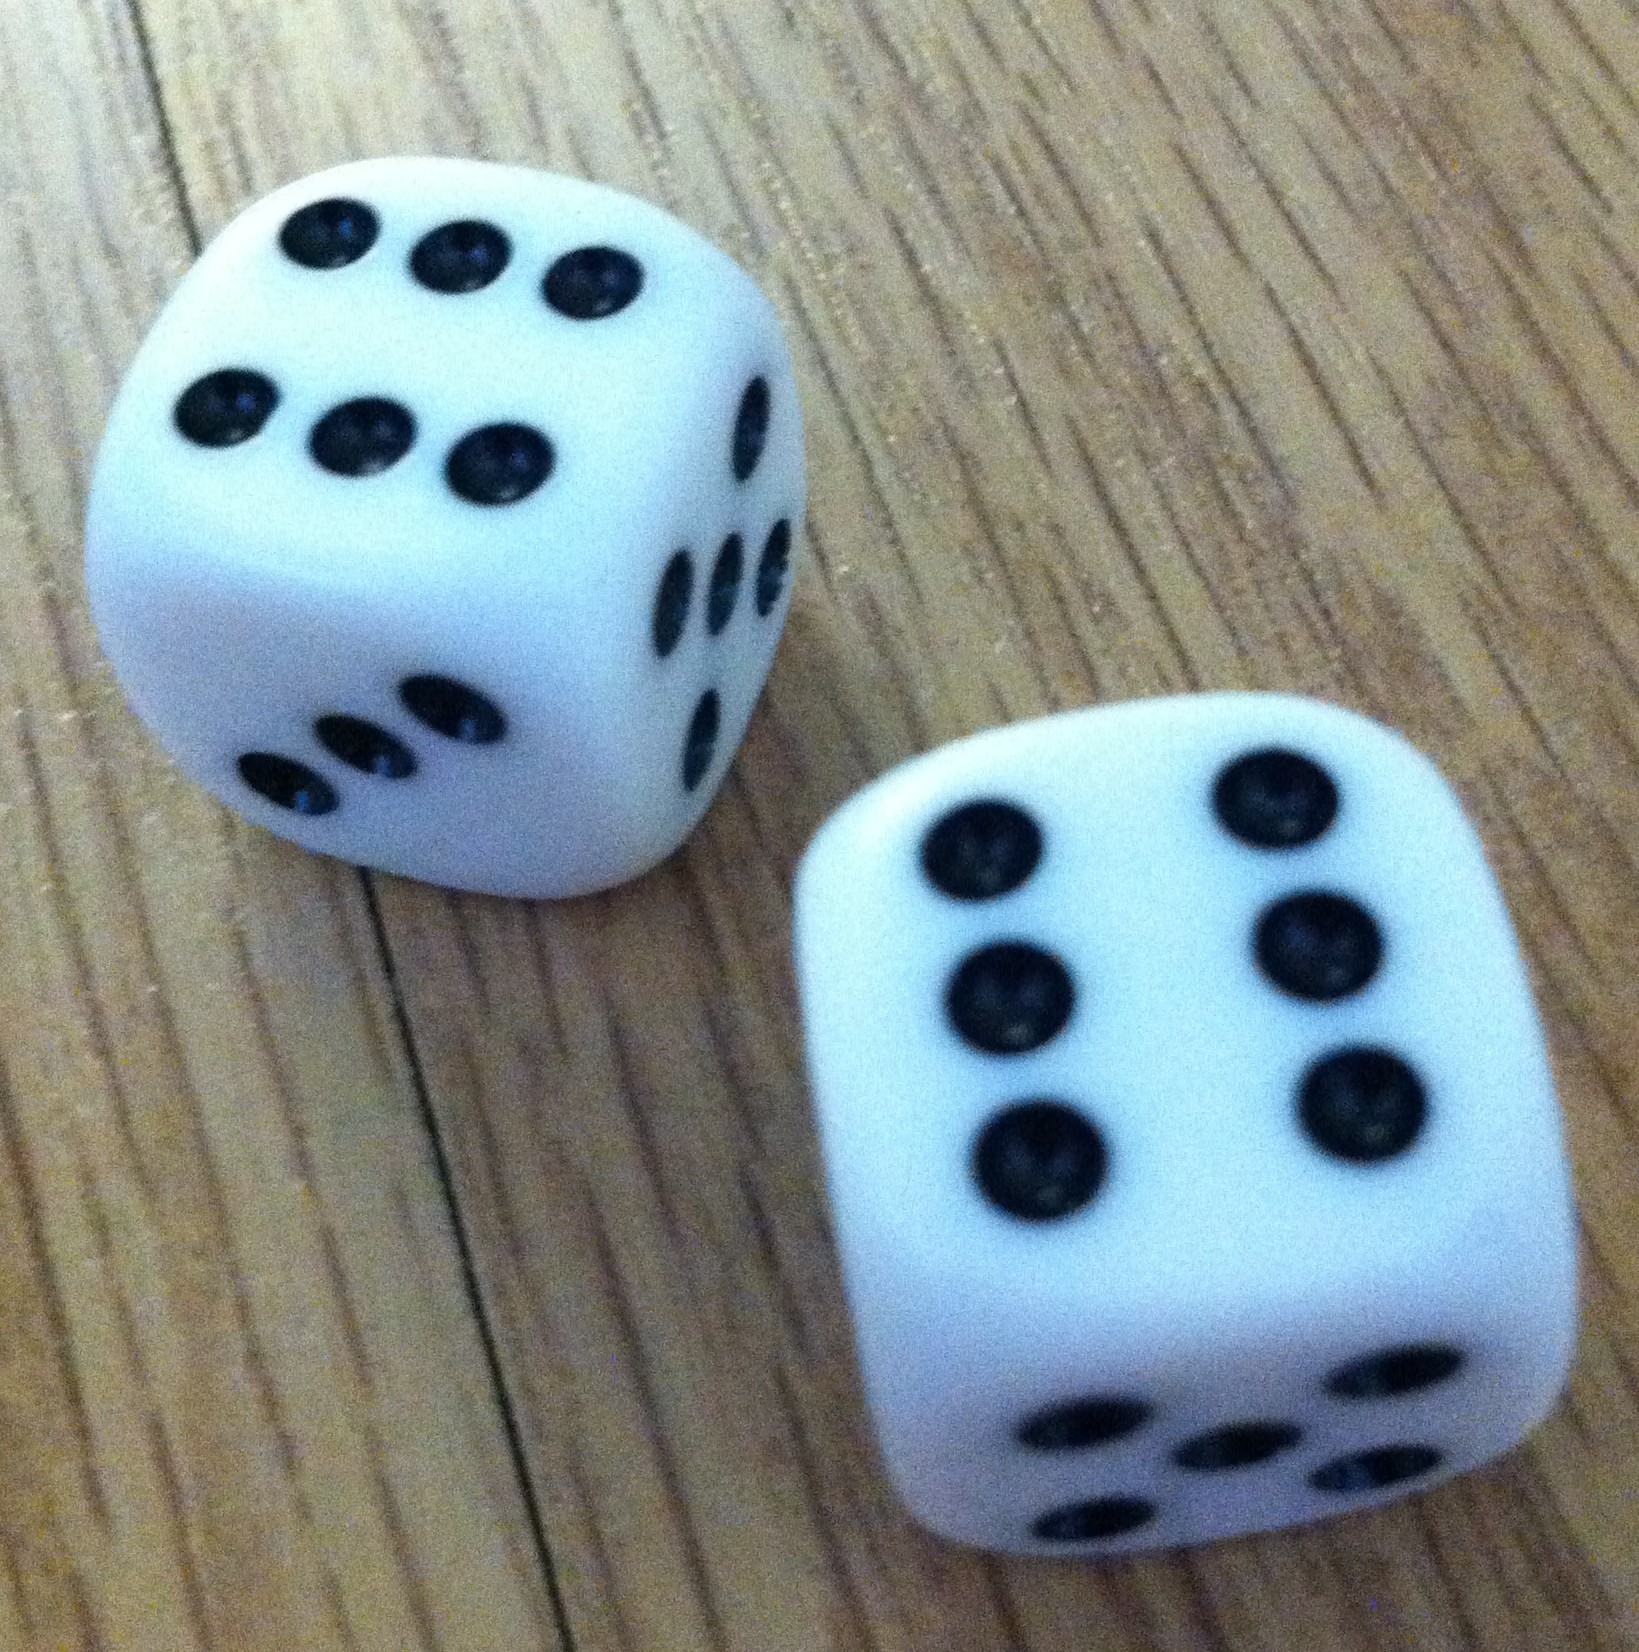
Dice
Photo: Amie Chuang

What is the probability of rolling any pair of numbers with two dice? Let’s first solve this and then confirm our calculated probability by simulating 500 dice rolls with a spreadsheet! In this post, we will focus on understanding basic probability concepts and then discover how with spreadsheets, we can actually see whether our calculated probability holds true!

Continue reading “Probabilities & Dice Roll Simulations in Spreadsheets”

Fibonacci and the Golden Ratio in Spreadsheets

© Photographer Dan Tataru|Dreamstime.com

What do sunflowers, shells, honeybees, the Parthenon, and human arm length measurements have in common? All reflect a remarkable pattern of numbers. Now just where does this intriguing sequence of numbers come about? Let’s discover the Fibonacci sequence and the Golden Ratio and how we can use spreadsheets to calculate them! Continue reading “Fibonacci and the Golden Ratio in Spreadsheets”

Hypothesis Testing with Spreadsheets – Part II

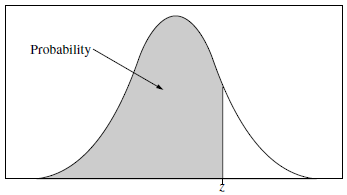
Is the “height success rate” for seeds grown in organic soil significantly higher than that for those grown in the non-organic soil? Let’s use a statistical test to find out! But before we delve in, let’s review the amazing Central Limit Theorem (CLT). Why so remarkable, you may ask? Continue reading “Hypothesis Testing with Spreadsheets – Part II”

Hypothesis Testing with Spreadsheets – Part I

seedlings2
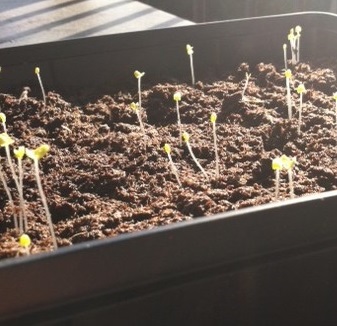
Seedlings for Experiment. Photo: Amie

What is the impact of organic soil on a seedling’s height? Will an organically-grown seedling be taller than one grown in non-organic soil? Armed with data, we’ll now tackle these questions by performing a statistical test in a spreadsheet!

To see how we our experimental design and data collection method, please see: www.spreadsheetsolving.com/posts/experiment-spreadsheet Continue reading “Hypothesis Testing with Spreadsheets – Part I”

Design & Conduct Experiments with Spreadsheets

seedlings2
Seedlings for Experiment. Photo: Amie

Seeking science experiment ideas? Want to conduct an experiment? Curious about hypothesis testing? Understanding how to design and test an effective experiment is an essential skill. Let’s investigate this research question: What is the impact of organic soil on a seedling’s height?

Spreadsheets are a platform to test an experiment or conduct a research study. With spreadsheets, we can collect & organize data, compute summary statistics, and even test hypotheses!

So, let’s begin our experiment with spreadsheets, statistics, seeds, & soil! Continue reading “Design & Conduct Experiments with Spreadsheets”

Pythagoras and SUMSQ

Ever heard of the philosopher and mathematician, Pythagoras of the 6th century BC? Perhaps you’ve come across one his most famous theorems during your geometry class. The Pythagorean Theorem states that in a right triangle, the sum of the legs squared is equal to the hypotenuse squared. 

Continue reading “Pythagoras and SUMSQ”

Coin-flipping Life Experiment

© Photographer Dana Rothstein | Agency: Dreamstime.com

What if life’s major choices are to be decided by the flip of a coin? Interestingly, the Freakonomics Experiments project – a collaboration between Freakonomics and the University of Chicago –  is enlisting volunteers to do just that to study human behavior of decision-making. Intriguing, right?

An essential feature of this experiment is generating a truly random toin coss. While the Freakonomics Experiments team ensured coin toss randomness by using the Swiss-based Fourmilab’s True Random Number Generator (more info here), we can create our own coin toss using spreadsheets!  Really? You bet!

Continue reading “Coin-flipping Life Experiment”