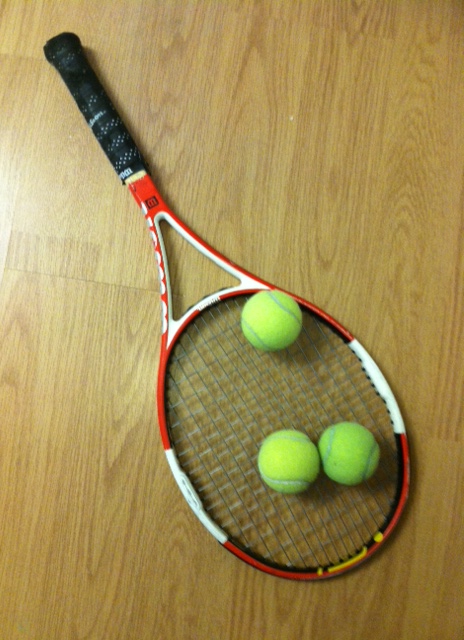
Improve Decision-Making with Spreadsheets

Spreadsheets are a framework for evaluating choices! Which brand of jeans should I buy? Which restaurant should we go? To which colleges should I apply? In our tutorial video and post, let’s discover how to create a model-based decision-making process with spreadsheets!
Continue reading “Improve Decision-Making with Spreadsheets”

Fibonacci and the Golden Ratio in Spreadsheets

© Photographer Dan Tataru|Dreamstime.com

What do sunflowers, shells, honeybees, the Parthenon, and human arm length measurements have in common? All reflect a remarkable pattern of numbers. Now just where does this intriguing sequence of numbers come about? Let’s discover the Fibonacci sequence and the Golden Ratio and how we can use spreadsheets to calculate them! Continue reading “Fibonacci and the Golden Ratio in Spreadsheets”

Breaking it down: Sample Standard Deviation

We have a set of data and want to understand its characteristics. A great starting point is to measure the central or typical value and the dispersion around that value. In this post, we will focus on the latter – specifically a standard measure of spread known as the sample standard deviation!

Continue reading “Breaking it down: Sample Standard Deviation”

Averages Matter: Mean, Median, & Mode

Illustration by Amie

The average value is very desirable in the world of statistics! Known as the central tendency, averages provide a way to understand the characteristics of a broad set of data. What are the different measures of central tendency? How can we calculate them? Let’s explore this below!

Continue reading “Averages Matter: Mean, Median, & Mode”

Prioritize & Organize with Spreadsheets

Effective time management and prioritization skills are essential to your personal, academic, and professional success. So, let’s learn how to create a priority log with a spreadsheet! Both an organizational and prioritization tool, this practical spreadsheet application will help you better manage your time when tackling projects, papers, tasks, and other deadlines. Continue reading “Prioritize & Organize with Spreadsheets”

How to Visualize Data

Is the typical New Yorkers’ overall “well-being” better than that of the national average? Nope! How did we quickly conclude this? Check out the graph to the right. Data visualization is an effective (and fun) way to understand information!

Too much information can be overwhelming. But there are ways to channel the desired data and convey it in a way that makes it quick and easy to understand. Let’s discover the power of data visualization by creating a flexible, automatic tool shown below. To see this tool live in action, see our 2-minute video below:

Continue reading “How to Visualize Data”

How to Create Charts in Google Spreadsheets

"How I Met Your Mother."  Source: YouTube
“How I Met Your Mother.” Source: YouTube

Charts are everywhere – books, newspaper articles, magazines, ads, and even TV shows [Click here for a video clip of How I Met Your Mother]. Valuable, practical, and fun, charts enable us to visualize and understand data. In 3 steps, you can build any chart in Google spreadsheets. Continue reading “How to Create Charts in Google Spreadsheets”

Hypothesis Testing with Spreadsheets – Part II

Is the “height success rate” for seeds grown in organic soil significantly higher than that for those grown in the non-organic soil? Let’s use a statistical test to find out! But before we delve in, let’s review the amazing Central Limit Theorem (CLT). Why so remarkable, you may ask? Continue reading “Hypothesis Testing with Spreadsheets – Part II”

Hypothesis Testing with Spreadsheets – Part I

seedlings2
Seedlings for Experiment. Photo: Amie

What is the impact of organic soil on a seedling’s height? Will an organically-grown seedling be taller than one grown in non-organic soil? Armed with data, we’ll now tackle these questions by performing a statistical test in a spreadsheet!

To see how we our experimental design and data collection method, please see: www.spreadsheetsolving.com/posts/experiment-spreadsheet Continue reading “Hypothesis Testing with Spreadsheets – Part I”

Design & Conduct Experiments with Spreadsheets

seedlings2
Seedlings for Experiment. Photo: Amie

Seeking science experiment ideas? Want to conduct an experiment? Curious about hypothesis testing? Understanding how to design and test an effective experiment is an essential skill. Let’s investigate this research question: What is the impact of organic soil on a seedling’s height?

Spreadsheets are a platform to test an experiment or conduct a research study. With spreadsheets, we can collect & organize data, compute summary statistics, and even test hypotheses!

So, let’s begin our experiment with spreadsheets, statistics, seeds, & soil! Continue reading “Design & Conduct Experiments with Spreadsheets”

Introducing VLOOKUP & College Education Value

A good friend introduced me to a site by Payscale that compares the “value” of a college education through a measure called the ROI (Return on Investment), broadly calculated as the difference between the expected future income stream of a college graduate and the actual cost of attending college. Continue reading “Introducing VLOOKUP & College Education Value”

How to Create an Online Game in 5 steps

Did you know you can create an interactive online Tic Tac Toe game in 5 steps? Google spreadsheets makes this possible! Two beautiful features of a Google spreadsheet are 1) it is online-based, so anyone with an Internet connection can play; and 2) Google spreadsheets are free!  To access it, view our post: spreadsheetsolving.com/access Continue reading “How to Create an Online Game in 5 steps”