Ah, the Super Bowl – the action, the excitement, the commercials? The only issue with the Super Bowl is for the 97% of Americans located outside of the two metropolitan areas surrounding the two teams playing, the outcome of the game doesn’t really matter as much. To fix that, we have gambling…specifically, the classic Super Bowl squares pool.
For those who are unaware, a Super Bowl squares pool is a 10×10 grid, where each person can purchase a space on the grid. The numbers 0-9 are randomly assigned for each axis with one of the two teams assigned to each axis. Prize payouts usually happen each quarter for the square that matches the ones digit of the actual in game score for each team.
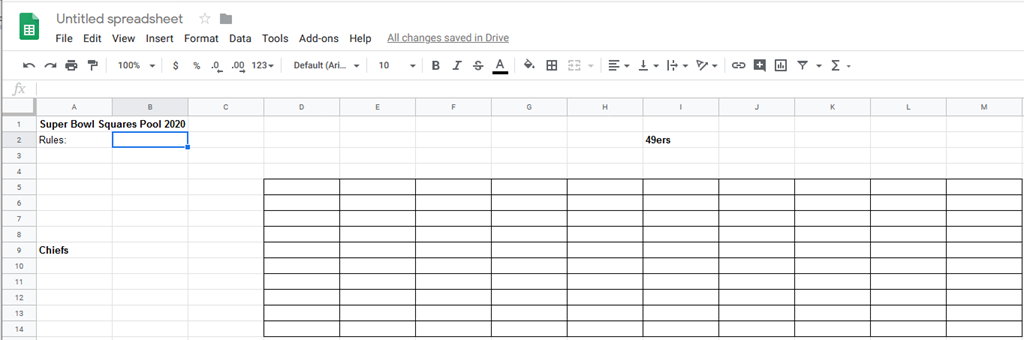
This will be a simple spreadsheet for building a square pool on a Google Spreadsheet:
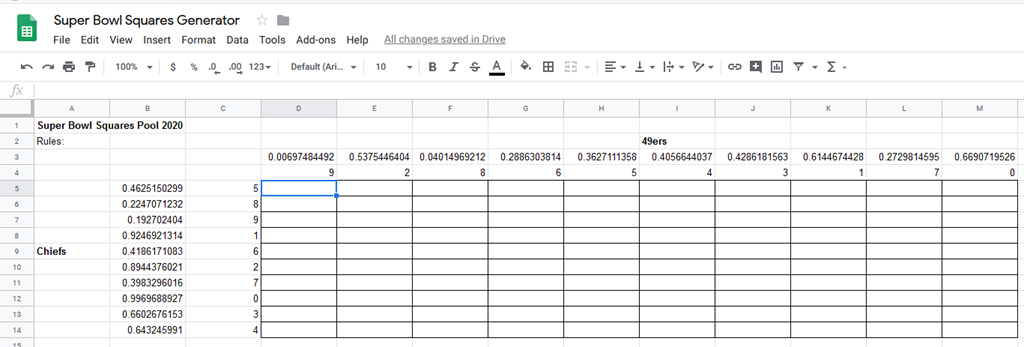
First, we highlight a 10 x 10 grid, and assign the teams to each axis:
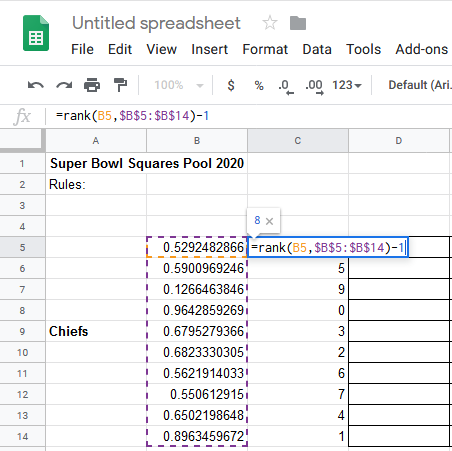
Next, we can build our random 0-9 number generator, first we put the formula “=rand()” in each of the 10 spots, then we use the formula RANK() to rank the random numbers. We have to subtract 1 from the RANK() function because we want the numbers 0-9 while RANK() would produce numbers 1-10.
Do the same thing for the columns, set the stakes and the payout rules, let people pick what squares they want, and then have a “drawing.” The rand() function recalculates after every spreadsheet action, so you’ll want to have an official “next action is final” with everyone around, then immediately screenshot and print the whole table before it recalculates again. Or else people will be suspicious when you have all the 0’s and 7’s…
Here’s the link to the Google Spreadsheet: Super Bowl Squares Pool Generator. Remember, you can access it by going to File->Make a Copy